If you are looking for how to buy the book, please follow this link.
 There are three sample datasets used in the Tableau 7 book that are free for anyone to use, but you must be a registered user of our site to access these downloads. Registration connects us with you so we can e-mail you 2-3 times per year with course schedules, book updates and other topics of interest. You may unsubscribe from the e-mail list at anytime by visiting our home page and clicking on the unsubscribe link. Please note that we will never share this registration information with another company.
Uncategorized
Rapid Graphs with Tableau Software 7 now available on Amazon, Kindle and Nook

Buy the Kindle version at Amazon, just $9.97! (free preview)
Buy Nook book at Barnes & Noble, just $9.97! (free preview)
Buy the print version at Amazon US, UK, Germany,
France or Spain (only in English, regardless of source country)
International shipping alternative to Amazon
Still using Tableau 6? Yes! You can buy the 6 version!
Tired of boring spreadsheets and data overload from confusing graphs? Master the art of rapid graphs with Tableau! Tableau is designed with one goal in mind, to give you the power to quickly explore and understand your data so that you can make informed decisions in a wide variety of real-world situations. After learning Tableau, you will be able to communicate your findings with audience-friendly graphs and tables.
“A picture is worth a thousand words” is a common saying that is more relevant today
Newspapers of Spain dashboard for Tableau Customer Conference 2012
In honor of our beautiful host country, Spain, we have created a dashboard of the major newspapers available in Spain by city, circulation and whether it is in Catalan (the language of this area in Spain.) This dashboard was created in just 30 minutes with Tableau and a glass of Spanish wine at our side! … Read more
Detailed review of Tableau Data Blending by a PhD Student at UW- Seattle
From the article conclusions: “Data blending is a new feature in Tableau that simpliï¬es the process of integrating data from a variety of heterogeneous sources. We presented several compelling customer applications that leverage the feature and highlight its usefulness for interactive visual analysis. Additionally, we are engaging with our customers to improve the flexibility … Read more


A dashboard to select high-quality stocks with high yield and low volatility
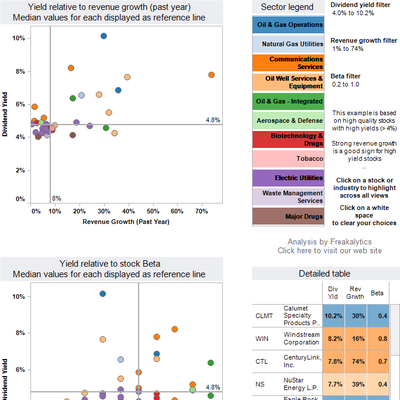 Selecting a “safe” stock with a solid dividend is quite popular in the current economic climate. The traditional “safe” investments are paying extremely low interest rates while many American companies are growing revenues while paying out strong dividend yields (4% and higher) that exceed those of government bonds. In late December, I selected a set of stocks with solid financial strength ratings, positive revenue growth in the past year, dividends of 4% or more and lower than average stock price volatility (also called the beta of a stock.)
After some data cleanup, I assembled this into a dashboard for quick review and exploration. This dashboard allows you to select higher yields, higher revenue growth or lower levels of volatility. By clicking on an individual stock, you are taken to MSN Money web site (below initial dashboard) for their current “StockScouter” rating.
Helping a state government agency – a dashboard of poverty rates in Utah
 We are always excited to see new people using visual analytics with data in the public interest. After seeing some great poverty analysis work from the Utah Department of Workforce Services, we wanted to share some ideas that might provide inspiration to them.
Here is the original chart
Business Analytics in Fortune Magazine – Pat Hanrahan, Tableau Co-founder
A nice article on Tableau and visual analytics appeared in Fortune magazine this week. “Former Pixar engineer Pat Hanrahan has found a new calling organizing and analyzing business data, and bringing the information to life. Mr. Incredible: Pat Hanrahan in his lab at Stanford How many enterprise software executives can brag that they have been … Read more
Cool video of animated Freakalytics logo opens Tableau Customer Conference 2011
![]() Who said that analytics can’t be a fun way to start your day@f25 Tableau animated our dashboard at https://freakalytics.com/snp-pub-freak/ and set it to the music of Journey! Awesome job Tableau and a great way to kick-off the conference!
Who said that analytics can’t be a fun way to start your day@f25 Tableau animated our dashboard at https://freakalytics.com/snp-pub-freak/ and set it to the music of Journey! Awesome job Tableau and a great way to kick-off the conference!
iPad & tablet competitors profit estimates through 2015 – building on Gartner unit estimates
 GigaOM’s recent article on the growth of the iPad and overall tablet-related OS market inspired me to take their forecasts one step further- actual profit estimates through 2015 per major player in the article.
My forecasts are indeed rough, but attribute higher and lower profits to the various vendors based on the nature of their product, likely price point and direct or indirect control they will have over the actual distribution of their platform. For example, Android is expected to be heavily partnered for their distribution (the upcoming Kindle is just one example), this implies lower profit per unit. Meanwhile, Apple with their early market lead and total control over the tablet sales implies higher profit per unit sold. Regardless, these are rough estimates, but fascinating to consider. Most incredible