How long should my presentation be?

Always leave them wanting more! –P.T. Barnum Creator of “The Greatest Show On Earth!®“ About our Presentation Length Calculator Creating compelling presentations that are clear and actionable are the lifeblood of successful analyst teams. Often, analysts have worked on problems for days or weeks and have much more material to present than is relevant or … Read more

Shark Tank investments – using data to understand the Sharks

Using data from the first four seasons of the Shark Tank, Freakalytics has assembled a few fascinating insights for fans and potential entrepreneurs that may come before the Sharks in future seasons. While Barbara Corcoran is the most frequent investor. Mark Cuban is the investor with the largest amount invested and Mr. Wonderful invests the … Read more

Communicate Your Results, a Case Study from
the 7th C of The Accidental Analyst

You can have brilliant ideas, but if you can’t get them across, your ideas won’t get you anywhere. –LEE IACOCCA Engineer on the original Ford Mustang design team and CEO during Chrysler’s comeback in the 1980’s.   From the Seven C’s of Data Analysis Framework     Maria is a Senior Sales Analyst for an … Read more

From Business Intelligence to Visual Analytics
Craft a Winning Data Strategy

Stephen McDaniel and Eileen McDaniel, Ph.D. Freakalytics, LLC Topics: Data Analysis, Visual Analytics and Business Intelligence This was originally published in the TDWI FlashPoint Newsletter in August of 2014 Italicized sections, images and their captions were not part of the TDWI version. Until recently, visual analytics was considered a niche area. Those days are quickly … Read more

Three great data visualization stories from Qlik World 2014

At the Qlik World 2014 expert data visualization panel, moderated by Donald Farmer, Donald asked each panelist to offer up one of our favorite data visualizations for inspiration and learning. Alberto Cairo, Visualization at The University of Miami, offered up John Snow’s 1854 map of London that helped demonstrate that cholera was spread by contaminated … Read more

Great vs good analysts, software obsessions and informing executives

Charts and graphs to inform Are your charts and graphs actually informing people? Can I actually make a decision from your presentation? If not, why should I or the executives care? Cool software, but what about the business? It’s easier to obsess over the complex but oh so cool software features than to truly understand … Read more

Honesty, the first principle of good analytics


ph-design-evolution-eichler-rams
Photo from Braun.com

Meet Dieter Rams – Industrial Designer

Dieter Rams is a German industrial designer most closely associated with the minimalist designs of the consumer brand Braun. Dieter was head of design at Braun for over 30 years, where he became famous for creating an austere aesthetic while focusing on user-friendliness. His philosophy is summed up in his saying, “Weniger, aber besser.” which translates into “Less, but better.” He has won many awards through the years including the World Design Medal and the Ikea Prize.

Dieter’s impact reaches beyond his retirement as he is now impacting design in the 21st century, with a company widely considered a leader in technology design, Apple, acknowledging a debt to Dieter as inspiration for many of their design decisions. The Head of Design at Apple wrote, “Rams’s work is beyond improvement… Rams’s ability to bring form to a product so that it clearly, concisely and immediately communicates its meaning is remarkable.”

Braun-Apple-Link
From Braun, “90 years of history”


Ten principles of good design

As a prolific designer, Dieter formulated ten principles of good design. In this series of articles, I will adapt several of these principles for guidance in creating good analytics. I have selected the sixth principle of good design as the one I consider most important for good analytics.


The sixth principle of good design

6. Is honest – It does not make a product appear more innovative, powerful or valuable than it really is. It does not attempt to manipulate the consumer with promises that cannot be kept.


Freakalytics_princples_good_analytics_1_003_smallThe first principle of good analytics

Read more

Build a Basic Dashboard in Tableau 8
Excerpt from Rapid Graphs with Tableau 8

Freakalytics_Dashboard_Tableau_8_Basic
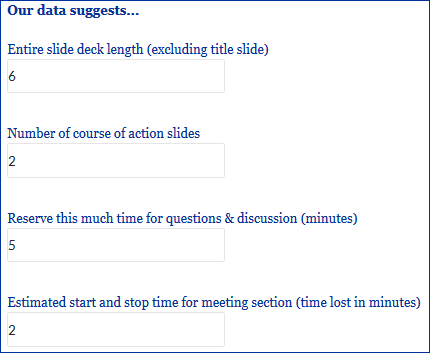
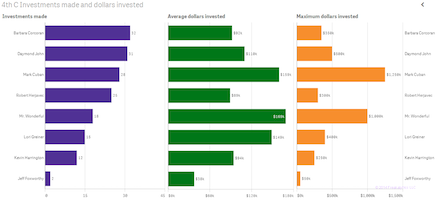
Appendix #2—Build a Basic Dashboard

We’ve taught entire courses on how to design and build dashboards in Tableau over multiple days, so the topic can be quite complex. In this section, you will learn the basic functionality so you can get started. For more advanced dashboards, visit www.Freakalytics.com/examples.

Dashboard Audience
VP of Sales at a cheese maker that sells to the public and to gourmet retailers

Overall Objective of Dashboard
Sales updates for monthly review by Sales Vice President (VP)

The Sales VP has four questions:
1. What are sales by state?
2. What were sales by customer contact method in 2013 compared to 2012?
3. What are the actual sales by item versus the target sales?
4. What are the actual sales by customer contact method versus the target sales?

Download the Cheese Factory sales data packaged workbook from www.Freakalytics.com/rgts8d

Included in the workbook:
Data source contains two years of sales data for 2012 and 2013.
Four worksheets with views answering the four questions above.
The final dashboard is illustrated at the end of this appendix.

Build the dashboard
Open the workbook, and in any one of the worksheets, on the main menu, select Dashboard → New dashboard. In the Dashboard pane on the left side, double-click on each of the four worksheets in the numbered order. Also in the Dashboard pane, in the Dashboard Size section at the bottom, change Desktop to Automatic so the 4 views fit within the workspace. The worksheets are arranged in the order added and the legends for Q1 and Q2 are on the right.

Adjust containers

Dashboards are comprised of containers that contain the views, legends and filters and are outlined by solid lines when you click on them. First, move the legends to the left side of the dashboard.

Read more

PowerTrip Analytics™ 2014
Candid Quadrants™
Based on three-year visual analytics cost estimates

Detailed cost comparisons across all seven visual analytics offerings at PowerTrip Analytics™ pricing review tables. Read individual product details, highlights and examples: Microstrategy Analytics Desktop, SAP Lumira, Tibco Spotfire, Microsoft Power BI, Tableau Desktop, QlikView, and SAS Visual Analytics.

Download data to predict gender using first name (US data)

Do you have data with just first names or even just first initials but no information on the person’s gender/sex? If you would like better insights on your customers, based on whether they are likely male or female, then this data download is a great way to maximize your ROI! Download it today and begin … Read more