Data Driven Conference 2012

We are having a great time at the Data Driven Conference in Columbus! Our first session was standing room only and we are presenting the same talk a second time at 1:30 in E161.

Interesting questions include “how do you become better at asking the right questions that lead to better analysis” and “how do you communicate with IT to get better data”?

To buy a copy of The Accidental Analyst, please visit www.AccidentalAnalyst.com.

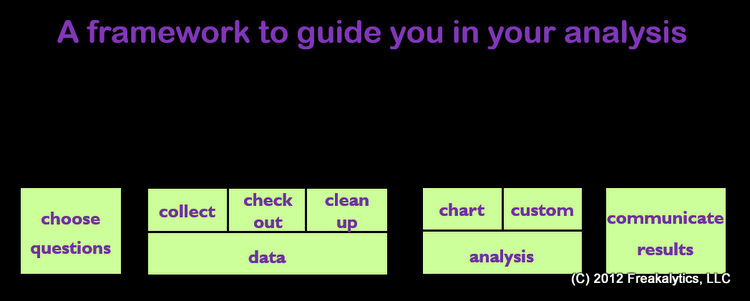
Here is our infographic that we created

Read more

Patriotic colors and maps in Tableau (US colors)

 
While preparing for a conference, we decided to create a map to show the US states using patriotic (US flag) colors.   The colors of the US flag are precise, so we needed to modify the Tableau preferences file to use the correct colors (also, white is not part of the Tableau color palette for discrete data items.)

After modifying our Preferences.TPS file with a new US Flag color palette and saving it to My Tableau Repository (a directory, typically in My Documents), we were able to create the red, white and blue map of the US!   To download the Maps, a sample workbook and the changed Preferences.TPS file, just log in below.

Read more