 At Freakalytics, we frequently use R (often referred to as RStats) in our client projects and wanted to share our success using the RStudio Interactive Development Environment (IDE) with you. So, we created the RStudio® Keyboard Quick Reference by Freakalytics. It is available to you, compliments of Freakalytics, as a PDF and later in this article as a searchable data table.
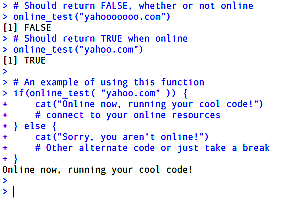
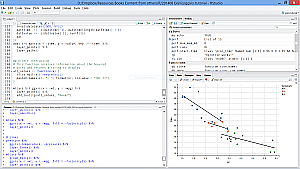
The RStudio IDE was built by the team at RStudio to make you more productive in the R world. It is a free, open source application for Windows, Linux, Mac and UNIX desktop users. RStudio Desktop includes an interactive R console, a smart editor that supports direct code execution, graphing interfaces, code history, a debugger and project management for R code and related files.
Download the RStudio® Keyboard Quick Reference by Freakalytics. The reference card is available as a PDF download for your convenience. The PDF version is printable and usable in most e-book applications.
In addition the PDF version, we are pleased to share online access to the RStudio® Keyboard Quick Reference as a searchable data table (click here to access the searchable data table in a dedicated window.) This searchable data table has all the shortcuts from the PDF -and- advanced shortcuts not shown on the PDF version (which is one-page for newer users of R).
How long should my presentation be?
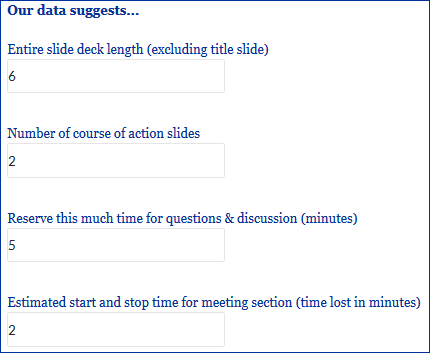
Always leave them wanting more! –P.T. Barnum Creator of “The Greatest Show On Earth!®“ About our Presentation Length Calculator Creating compelling presentations that are clear and actionable are the lifeblood of successful analyst teams. Often, analysts have worked on problems for days or weeks and have much more material to present than is relevant or … Read more