Why in-person Complete Tableau training by Freakalytics?

Everyone is busy and overloaded. People find it hard to add new techniques and tools into their daily work due to extensive demands in almost every level of every company. People are trying to do more with less, faster and better!

Why should you take off four valuable days to attend Tableau training by Freakalytics?

We were fortunate to have a distinguished attendee recently write-up her four-day training experience. Susan Kistler is Executive Director of the American Evaluation Association, an organization dedicated to assessing the strengths and weaknesses of programs, policies, personnel, products, and organizations to improve their effectiveness. AEA has approximately 5500 members representing all 50 states in the US as well as over 60 foreign countries.

Here is part of her review:

There is no substitute for learning at the feet of a master. And I’m not just saying this because I coordinate training for AEA. I’d been using Tableau Software for months.
Read more

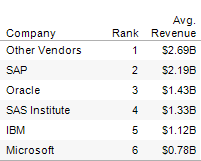
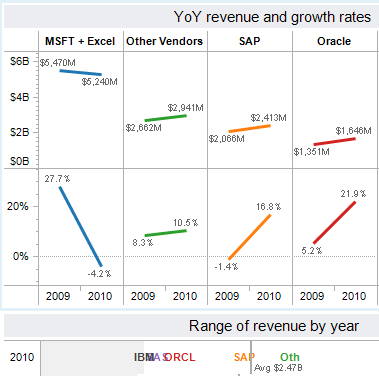
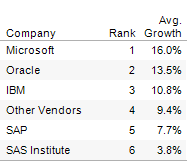
The growth of the traditional analytics vendors, 2008-2010 (Gartner and other data sources)

Growth rate
Winners- Microsoft, Oracle and IBM
Laggards- SAP and SAS

Market share
Winners- SAP, Oracle and SAS
Laggards- IBM and Microsoft

Growth combined with market share (using three-year ranks)
Winners- Oracle, SAP and Microsoft tied at 2nd
Laggards- IBM and SAS

From the recent Gartner press release, “There was little change year-on-year in terms of vendor rankings. SAP remained the No. 1 vendor in combined worldwide BI, analytics and PM software revenue in 2010, accounting for 23 percent of the market (see Table 1), followed by Oracle, SAS Institute, IBM and Microsoft.” I find this fairly interesting since the vast majority of companies I work with all cite Excel as the most frequently used analytics tool, by a long-shot. For more details on this thought, please review our second analysis that includes Excel in the “Analytics” market.

Without further delay, here is a dashboard summarizing the results, we have added data from 2008 for additional context and insight.

Read more

Quick reference for graph and dashboard design

Freakalytics has published a quick reference for building better graphs and dashboards. The Rapid Dashboards Reference Card has 64 tips readily available on four full-color, laminated pages. The card serves as a handy reference for yourself, your team and even your business audience during design meetings. Page 1 Excerpt, buy it at Amazon Page 3 … Read more