 Growth rate
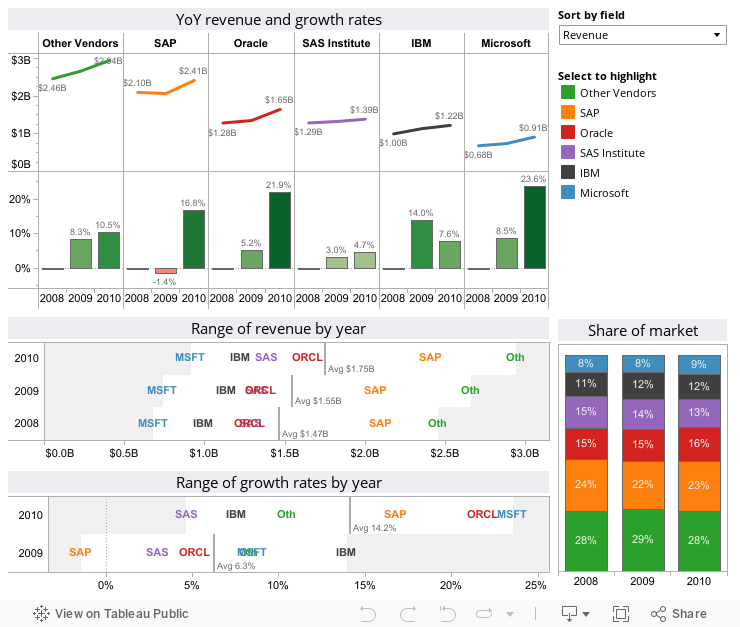
Winners- Microsoft, Oracle and IBM
Laggards- SAP and SAS
Market share
Winners- SAP, Oracle and SAS
Laggards- IBM and Microsoft
Growth combined with market share (using three-year ranks)
Winners- Oracle, SAP and Microsoft tied at 2nd
Laggards- IBM and SAS
From the recent Gartner press release, “There was little change year-on-year in terms of vendor rankings. SAP remained the No. 1 vendor in combined worldwide BI, analytics and PM software revenue in 2010, accounting for 23 percent of the market (see Table 1), followed by Oracle, SAS Institute, IBM and Microsoft.” I find this fairly interesting since the vast majority of companies I work with all cite Excel as the most frequently used analytics tool, by a long-shot. For more details on this thought, please review our second analysis that includes Excel in the “Analytics” market.
 |
 |
Without further delay, here is a dashboard summarizing the results, we have added data from 2008 for additional context and insight.
By taking a more expansive view of analytics, Microsoft is the decisive leader
In our review of the original Gartner data, we decided to enhance the original data for a second analysis. By adding a twist on the original Gartner definition of analytics, we included Microsoft Excel. While it is a simpler product than the expansive BI suites and it sells at a very modest ~$100 per seat, it is definitely the most widely used analytics and data management tool in the world. When examined through this lens, Microsoft’s share of market jumps 4X to control nearly 35% of the worldwide analytics market- more than double their nearest competitor, SAP.
 |
 |
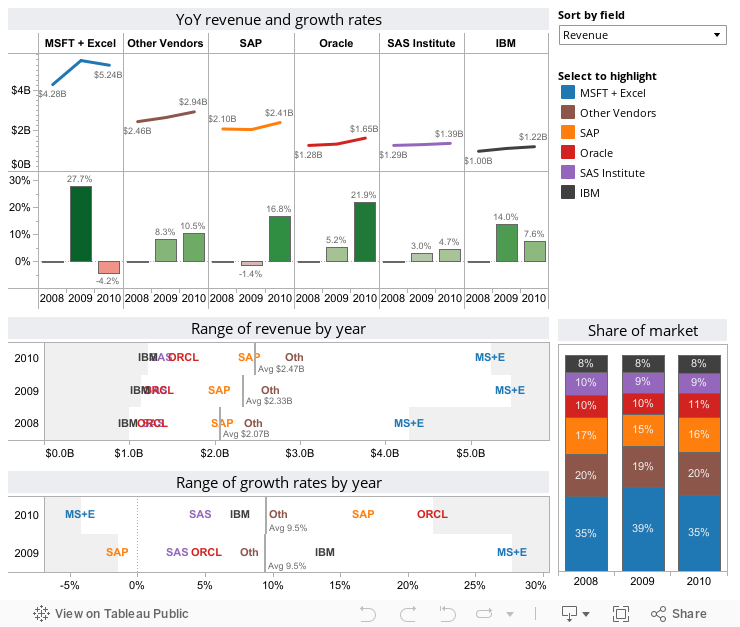
Growth rate (including Microsoft Excel)
Winners- Oracle, Microsoft and IBM
Laggards- SAP and SAS lagged the industry
Market share (including Microsoft Excel)
Winners- Microsoft, SAP and Oracle
Laggards- SAS and IBM
Growth combined with market share (using three-year ranks, including Microsoft Excel)
Winners- Microsoft, Oracle and SAP
Laggards- IBM and SAS
Please note that the Excel revenue estimates in the second analysis assume that 25% of Microsoft Office revenue is attributed to Excel demand/usage.
Freakalytics is the exclusive source of the original
Complete Tableau Training (4 days) and our new course,
Data Management and Visual Analytics with Tableau (2-days).
For a detailed review of Tableau features, pricing and capabilities, visit PowerTrip Analytics.
For the Tableau Online pricing calculator, click here.
Securely share R shiny apps
Develop R shiny apps
All on one dedicated, secure and powerful platform.