 Appendix #2—Build a Basic Dashboard
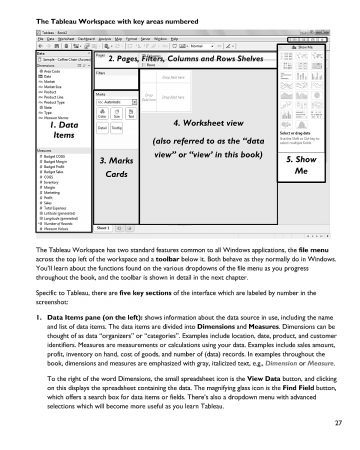
We’ve taught entire courses on how to design and build dashboards in Tableau over multiple days, so the topic can be quite complex. In this section, you will learn the basic functionality so you can get started. For more advanced dashboards, visit www.Freakalytics.com/examples.
Dashboard Audience
VP of Sales at a cheese maker that sells to the public and to gourmet retailers
Overall Objective of Dashboard
Sales updates for monthly review by Sales Vice President (VP)
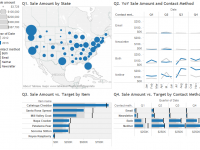
The Sales VP has four questions:
1. What are sales by state?
2. What were sales by customer contact method in 2013 compared to 2012?
3. What are the actual sales by item versus the target sales?
4. What are the actual sales by customer contact method versus the target sales?
Download the Cheese Factory sales data packaged workbook from www.Freakalytics.com/rgts8d
Included in the workbook:
• Data source contains two years of sales data for 2012 and 2013.
• Four worksheets with views answering the four questions above.
• The final dashboard is illustrated at the end of this appendix.
Build the dashboard
Open the workbook, and in any one of the worksheets, on the main menu, select Dashboard → New dashboard. In the Dashboard pane on the left side, double-click on each of the four worksheets in the numbered order. Also in the Dashboard pane, in the Dashboard Size section at the bottom, change Desktop to Automatic so the 4 views fit within the workspace. The worksheets are arranged in the order added and the legends for Q1 and Q2 are on the right.
Adjust containers
Dashboards are comprised of containers that contain the views, legends and filters and are outlined by solid lines when you click on them. First, move the legends to the left side of the dashboard.
Read more


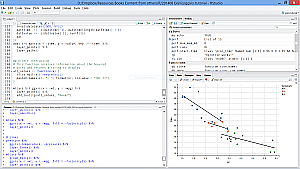 At Freakalytics, we frequently use R (often referred to as RStats) in our client projects and wanted to share our success using the RStudio Interactive Development Environment (IDE) with you. So, we created the RStudio® Keyboard Quick Reference by Freakalytics. It is available to you, compliments of Freakalytics,

 View and interact with the strategic customer sales and analyst exploratory dashboards below