Rapid Graphs with Tableau 8
The Original Guide for the Accidental Analyst
The 8 version of this book is published in grayscale in order to meet popular demand for a lower list price versus earlier versions (5, 6 and 7) of this book series.
 + Written by Tableau insider
& former product manager, teaching
Tableau to thousands since 2009
+ Real-world examples that you
can follow include tips
and tricks to save you time
+ High-def videos & solutions
+ The fourth edition—proven & trusted
Preview the table of contents and Chapter 1 here.
Exclusive to Freakalytics, we are granting free online access to Rapid Graphs with Tableau 8!
Build the core—Tableau basics—21
Download, install and open Tableau—22
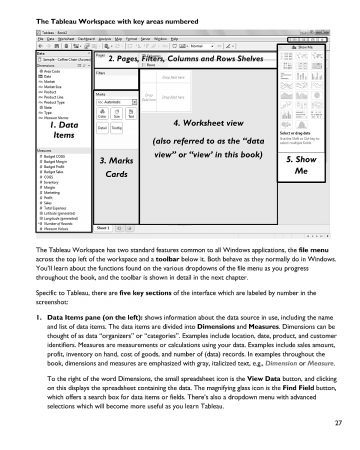
Connect to sample data and review the Tableau interface—25
“Show Me” Tableau in action—29
Categorically clear views—35
Go with the flow—more Tableau basics-41
Save time with the Tableau toolbar-42
When tables trump graphs-44
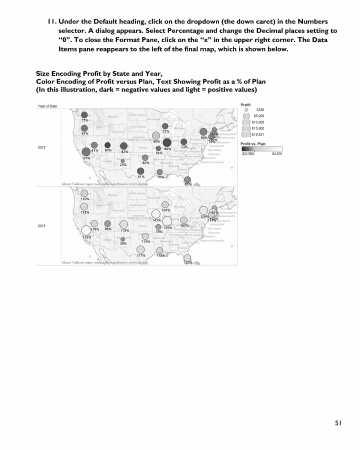
Insightful maps-48
View shifting—the underrated histogram and flexible bins-53
Exporting results to share your insights-58
Core view types in Tableau-59
Tables—an eye for detail-62
Text tables-62
Highlight tables-64
Heat maps-65
Bar Charts—five flavors
to meet your needs-66
Horizontal bars-67
Stacked bars-69
Side-by-side bars-70
Histogram-71
Bullet graphs-72
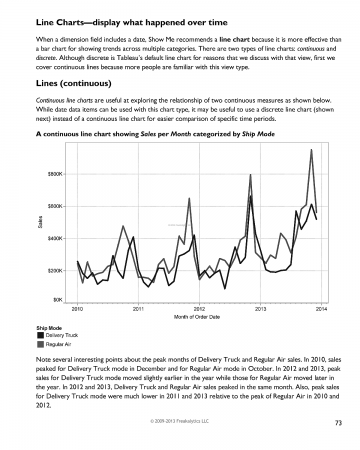
Line Charts—display what happened over time-73
Lines (continuous)-73
Lines (discrete)-74
Percent-of-Total—contribution of categories to the overall amount-75
Pie charts-75
Treemaps-77
Advanced view types in Tableau-79
Scatter Plots—explore relationships-82
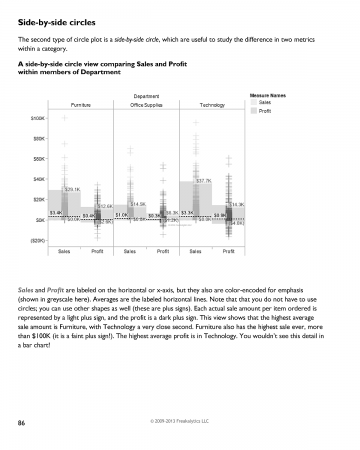
Circle Plots—go beyond bar charts-83
Circle views-83
Side-by-side circles-86
Packed Bubbles-87
Maps—great for location data-88
Symbol maps-88
Filled maps-89
Area Charts—track multiple groups over time-90
Dual combination-95
Gantt Chart—track activity over time-96
Take over with Tableau—View structure,
Marks Card, Summaries,
Formatting and Titles-97
Customize views using the Columns,
Rows, Pages and Filters Shelves-98
1. Columns-98
2. Rows-99
3. Pages-100
4. Filters-101
Enhance your visual appeal with the Marks card-103
1. Label-103
2. Text-104
3. Color-105
4. Size-107
5. Shape-108
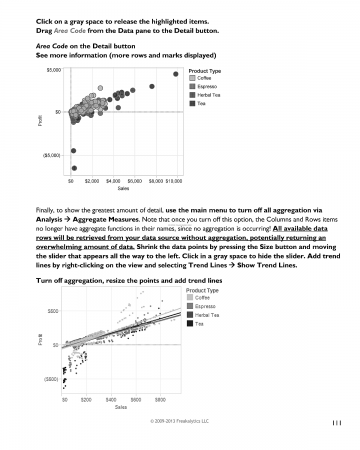
6. Detail-109
The Summary Card—handy description of your data-112
Headers and Axes-113
Titles, Captions, Field Labels and Legends-115
Format values in your views-117
Tired of boring spreadsheets and data overload from confusing graphs? Master the art of rapid graphs with Tableau! Our hands-on case study approach and more than 225 illustrations teach you how to quickly explore and understand your data to make informed decisions in a wide variety of real-world situations. We include best practices of visual analytics for ideas on how to communicate your findings with audience-friendly graphs, tables and maps.
“A picture is worth a thousand words” is a common saying that is more relevant today than ever as data volumes grow and the need for easy access to answers becomes more critical. This book covers the core of Tableau capabilities in easy-to-follow examples, updated and expanded for Version 8, as the fourth edition of the first book on Tableau. Learn how to be successful with Tableau from the team that started the original training program as the founding Tableau Education Partner!
“A must read for anyone interested in Tableau. Clear explanations, practical advice and beautiful examples!”
Elissa Fink – Chief Marketing Officer, Tableau Software
“A great work- this is going to be a much-loved book.”
Marc Rueter – Senior Director of Technology, Consulting and Strategy, Tableau Software
“Well written, easy to use book that has something for everyone.
A great resource if you are new to Tableau… but also useful tips for advanced users as well.”
Bob Morrison – Founder/CEO, Quadrant Arts Education Research and Chairman at MakeMusic
Stephen McDaniel
Stephen is passionate about helping people understand, present and take action with their data. He is author of SAS for Dummies, The AccidentalAnalyst and the Rapid Dashboard Reference Card. He has been on the Faculty of The American Marketing Association and The Data Warehouse Institute and is currently Director of Analytics at Tableau Software and Principal Analyst at Freakalytics, LLC.
Eileen McDaniel
Co-founder of Freakalytics, Eileen directs the development of books and course materials. She is lead author of The Accidental Analyst: Show Your Data Who’s Boss. This book provides a step-by-step analysis framework to help people who didn’t plan for a career as an analyst, but now must analyze data quickly and effectively.
244 pages
Black and white
Securely share R shiny apps
Develop R shiny apps
All on one dedicated, secure and powerful platform.