Rapid Graphs with Tableau 8 –
now on Amazon and on Freakalytics.com

Rapid Graphs with Tableau 8
The Original Guide for the Accidental Analyst

The 8 version of this book is published in grayscale in order to meet popular demand for a lower list price versus earlier versions (5, 6 and 7) of this book series.
Rapid_Graphs_Tableau_8_Freakalytics_Copyright_346_433+ Written by Tableau insider
& former product manager, teaching
Tableau to thousands since 2009

+ Real-world examples that you
can follow include tips
and tricks to save you time

+ High-def videos & solutions

+ The fourth edition—proven & trusted

+ Buy it on Amazon

Preview the table of contents and Chapter 1 here.

Exclusive to Freakalytics, we are granting free online access to Rapid Graphs with Tableau 8!

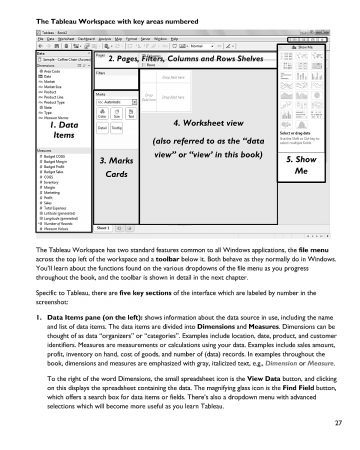
201307_Quick_Dirty_Tableau_8_Freakalytics_027Read Chapter 2 (pages 21-39)

Build the core—Tableau basics—21
Download, install and open Tableau—22
Connect to sample data and review the Tableau interface—25
“Show Me” Tableau in action—29
Categorically clear views—35

201307_Quick_Dirty_Tableau_8_Freakalytics_051Read Chapter 3 (pages 41-58)

Go with the flow—more Tableau basics-41
Save time with the Tableau toolbar-42
When tables trump graphs-44
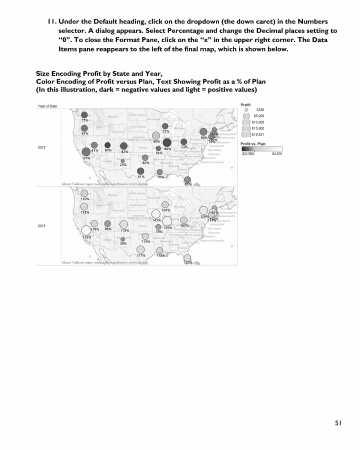
Insightful maps-48
Read more

Tableau tip- what’s smaller than a Tableau Data Extract?

While working with a client, they asked if I would show them how to analyze payment history and futures with a Gantt chart. I asked them to make a Tableau Data Extract (TDE). They created a TDE and then e-mailed it to me, all 25 Megabytes (MB)! Fairly big for an e-mail attachment (at many … Read more

Free Book Videos—Better Analytics in Tableau 8, Part 2

 
Forecasting-better-analytics-tableau-8-freakalytics-2If you display information the right way,
anybody can be an analyst.

–JOHN TUKEY
Prominent American statistician
who first used the word “software”


Part 2 Topics
      +Treemaps and packed bubble charts
      +Automatically selecting the right data for your analysis
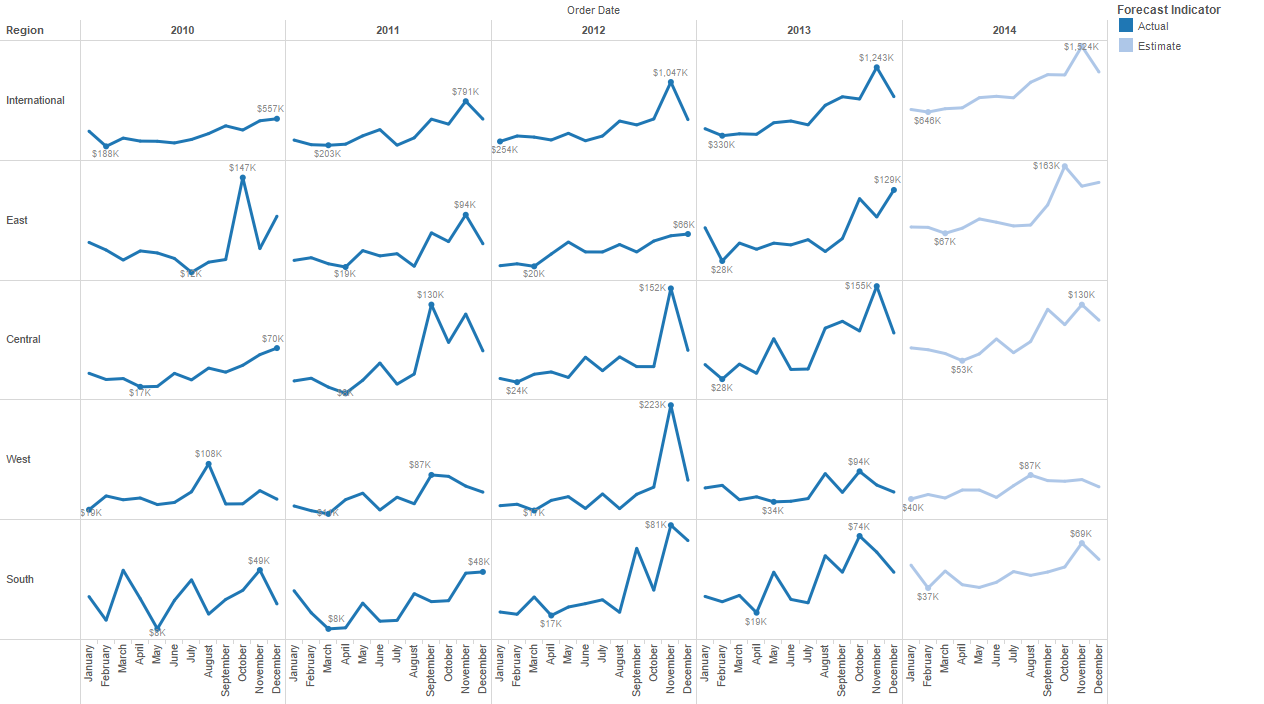
      +Forecasting for smarter planning
      +Google Analytics on the desktop—fast, beautiful and blend it with your data

The following videos are grouped by topic from our recent webinar, Better Analytics in Tableau 8. The work done in Tableau is also available for download (as a packaged workbook) below the relevant video. Tableau 8 is required to open the packaged workbooks on this page. The videos on this page are available to view in high-quality 1280×720 size, just click the four-arrow box in the bottom right of the video before clicking the play button.


Understanding relative contribution and finding extremes at a glance
Treemaps and packed bubble charts (8:43)

Download the Treemaps and packed bubble charts workbook (requires Tableau 8)


Automatically selecting the right data for your analysis
Data source filters (3:42)

Read more

Free Book Videos—Better Analytics in Tableau 8, Part 1

 
If you display information the right way,
anybody can be an analyst.

–JOHN TUKEY
Prominent American statistician
who first used the word “software”


Part 1 Topics
      +Multi-item color encoding
      +Multi-item data labels
      +Creating sets in Tableau 8
      +Union, intersection and partial sets; using sets in calculated fields

The following videos are grouped by topic from our recent webinar, Better Analytics in Tableau 8. The work done in Tableau is also available for download (as a packaged workbook) below the relevant video. Tableau 8 is required to open the packaged workbooks on this page. The videos on this page are available to view in high-quality 1280×720 size, just click the four-arrow box in the bottom right of the video before clicking the play button.


Finding data in your view
Multi-item color encoding (4:14)

Download the multi-item color encoding workbook (requires Tableau 8)


Finding data in your view
Multi-item data labels (3:04)

Read more

Show growth over time but hide the baseline in Tableau

A client asked,

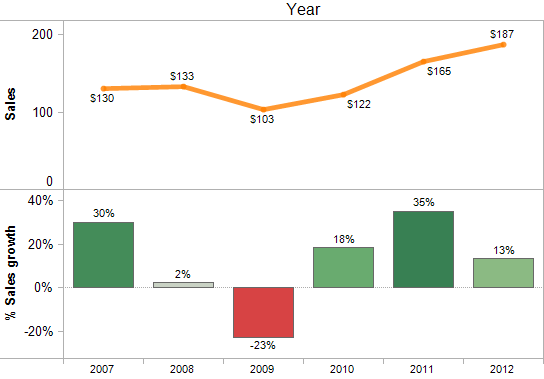
What I want to show is a YoY (year over year) or WoW (week over week) comparison – however the first data point is always missing – even when the underlying data are available.

For example:
The full set of data shows a null value for 2006 – just because there is no data available to compute a comparison.
Now I want to move the date filter to start @ 2007 – and now 2007 has a null value even though we have data available to compute that metric.
” What’s the issue and how can I display only years

Read more

Relative date filters in Tableau dashboards

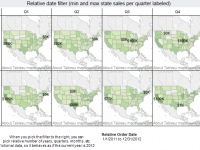
relative-date-filterUsing relative date filters in Tableau dashboards are a great way to keep your dashboard up-to-date with minimal effort. They also provide the consumer with great control if you display the relative date filter as a quick filter on the dashboard, since they enable extensive customization to the time period displayed.
 
In this dashboard, the current and prior year are displayed. By interacting with the quick filter, you could easily adjust this to one year, two quarters or even two months of data. Give it a try.

Read more

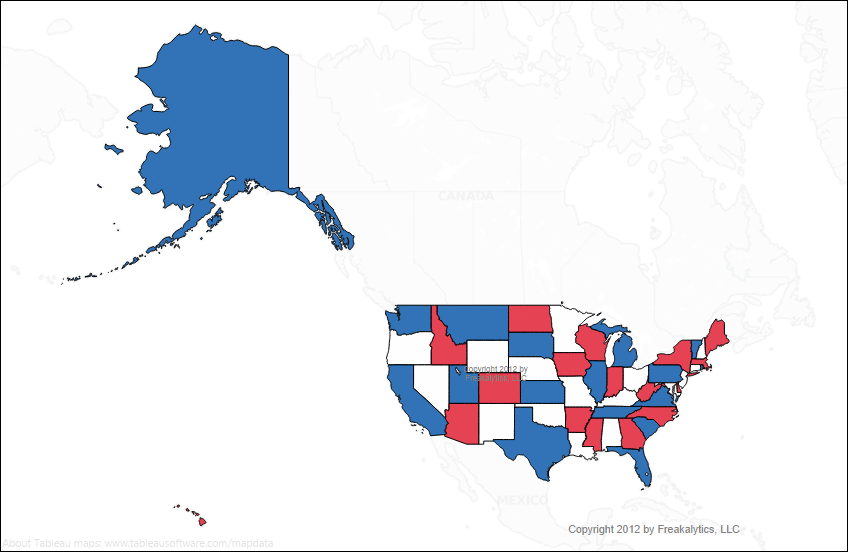
Patriotic colors and maps in Tableau (US colors)

 
While preparing for a conference, we decided to create a map to show the US states using patriotic (US flag) colors.   The colors of the US flag are precise, so we needed to modify the Tableau preferences file to use the correct colors (also, white is not part of the Tableau color palette for discrete data items.)

After modifying our Preferences.TPS file with a new US Flag color palette and saving it to My Tableau Repository (a directory, typically in My Documents), we were able to create the red, white and blue map of the US!   To download the Maps, a sample workbook and the changed Preferences.TPS file, just log in below.

Read more

Tableau ranking and displaying specific ranked values

Here’s a general solution for Tableau. It required a view with the level of detail displaying the area of interest, some table calc’s and parameters. I think the better general case solution wold use RANK and PERCENTILES from the database. However, with local data sources, this option isn’t possible! This link is a Zip file … Read more