Teams inlcuded in this week:
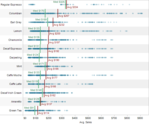
USC, LSU, Alabama, Oklahoma, Oregon, Georgia, Florida State, Michigan, South Carolina, Arkansas, West Virginia, Michigan State, Wisconsin, Clemson, Texas, Ohio State, Stanford, Nebraska, TCU, Virginia Tech, Oklahoma State, Kansas State, Florida, Boise State, Notre Dame, Louisville, Washington, Auburn, Georgia Tech, North Carolina, Utah, NC State, Baylor, South Florida, Texas A&M, Cincinnati, Brigham Young, Tennessee, Mississippi State, Virginia, Louisiana Tech, UCF, Houston, Rutgers, Southern Miss, Missouri, Florida Intl, Northern Illinois, Texas Tech
Conferences included in this week:
SEC, Big 12, ACC, Big Ten, Pac-12, Big East, USA, Ind, Mid-Amer, Mntn Wst, Sun, WAC