Balancing analysis of multiple years by filtering through the same month/day as today
 Topics in this example
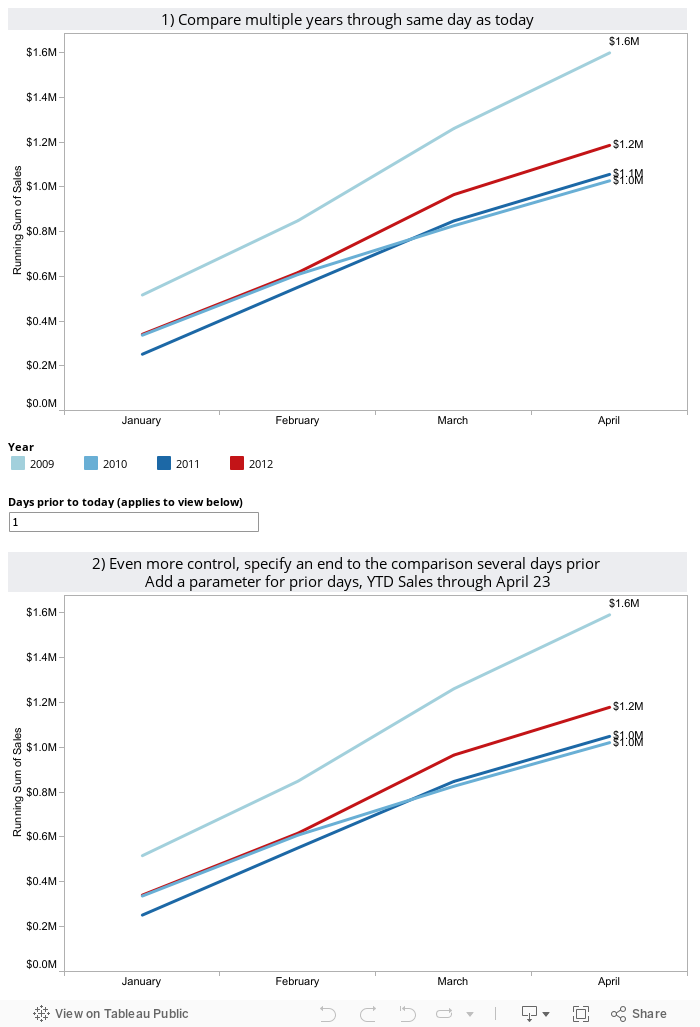
1) With a line chart, by placing Year(Order Date) on the Color shelf and Month(Date) on the columns, you can easily compare multiple years on the same pane of the graph. Just use Running Totals from the Quick Table Calculation dialog.
2) If this were real-world data, you would likely want to keep data through today; otherwise, prior years would likely be much higher since they are based on a full month while this year’s latest month is partially complete, unless it is the last day of the month!
3) By creating a calculated field that can check if the month/day is before today’s month/day and placing it on the filter shelf and selecting True, you can keep year-to-date data for the same periods in prior years.
4) The lower example goes one step further. It is not uncommon for complete business results to be unavailable for several days. If this is your situation, you can add a parameter to adjust the date cut-off, as appropriate.
We want to avoid this problem!

30 days later you can make a reasonable comparison

The solution
Freakalytics is the exclusive source of the original
Complete Tableau Training (4 days) and our new course,
Data Management and Visual Analytics with Tableau (2-days).
For a detailed review of Tableau features, pricing and capabilities, visit PowerTrip Analytics.
For the Tableau Online pricing calculator, click here.
Securely share R shiny apps
Develop R shiny apps
All on one dedicated, secure and powerful platform.