The following article features Tableau 6 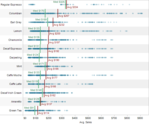
Reference lines, bands or distributions may be added to your views to emphasize particular values or areas that may be useful in interpreting your data. In particular, when comparing multiple groups or categories of data, reference lines and bands provide immediate feedback on the overall differences between the groups.
Reference lines
Reference lines are vertical or horizontal lines displayed on your view that mark requested values such as average, median, minimum, maximum, sum, total and constants (such as a line that separates the data points as being above or below a target). They can be added on any continuous axis.
1) Open the Sample – Coffee Chain (Access) data source included by default with Tableau 6
2) Place Sales on the Columns shelf and change the aggregate to Average.
3) Place Product on the Rows shelf,
State and Date on the Level of Detail shelf
and format Date to ‘MMMM YYYY’.
4) Change Automatic to Shape and the circle to a plus sign.
5) Right-click on the Avg. Sales axis. Choose Add Reference Line, change Scope to Per Cell, and click OK.
Do this a second time, but change Average to Median and click OK.
If you like, you can change the labels and colors of the reference lines by right-clicking on the axis and
selecting Edit Reference Line, and sorting the view.
Reference lines for average and median

Reference bands
Reference bands are shaded areas, typically highlighting the range of values in a section of the view. They cover the area between two relevant values, such as average and median, or minimum and maximums, which are illustrated in the next example.
1) Duplicate the prior sheet and right-click on the Avg. Sales axis to select Remove All Reference Lines.
2) Add Market to the Columns shelf to the left of Sales.
3) Right-click on the Avg. Sales axis and select Add Reference Line, choose the
Band icon at the top, Scope Per Cell, Band From Minimum to Maximum,
and change both Labels to None.
Reference bands for range between minimum and maximum

Reference distributions
Reference distributions are a modification of reference bands- they typically shade areas above, below and between two requested statistics. The difference is that they represent a distribution of values along an axis, and include confidence intervals, percentages, percentiles, quantiles and standard deviation.
1) Duplicate the last sheet.
2) Remove the reference line and Market from the Columns shelf.
3) Add Reference Line, choose Distribution, Per Cell, under Computation, choose Percentiles and type in 10,90.
Reference distribution for the 10th and 90th percentiles

Tableau allows you to customize reference lines, bands and distributions in many different ways, so check out the menus to explore the wide array of options.
Securely share R shiny apps
Develop R shiny apps
All on one dedicated, secure and powerful platform.