Chris Stolte, Chief Development Officer at Tableau introduced
Six senior developers on stage for a preview of Tableau 7.
Chris Stolte
Tableau’s mission is help people see and understand their data.
How much simpler can it get@f26
Tableau was started while at Stanford. This shot shows an early office and images of Tableau 1.0.
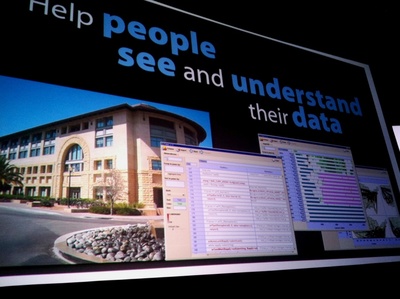
Tableau 1.0 shown- they have come a long way!
Some highlights of Tableau 7 include a projected release date of January and
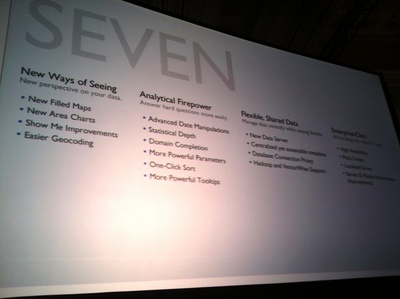
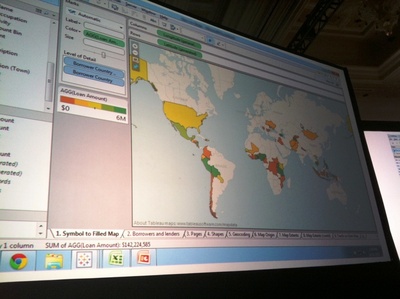
1) Rich mapping
a. Filled maps
2) User experience
a. Show Me
b. Dashboard simplicity
3) Tableau Data Server
a. Simplifies company-wide sharing of analyst data models
b. Avoid moving extracts to the desktop for local analysis
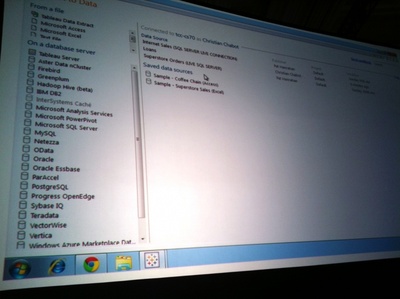
Data server connections
Also displays the wide range of data sources in Tableau 7
Ian Heath, one of the earliest employees at Tableau and a famous Lego artist
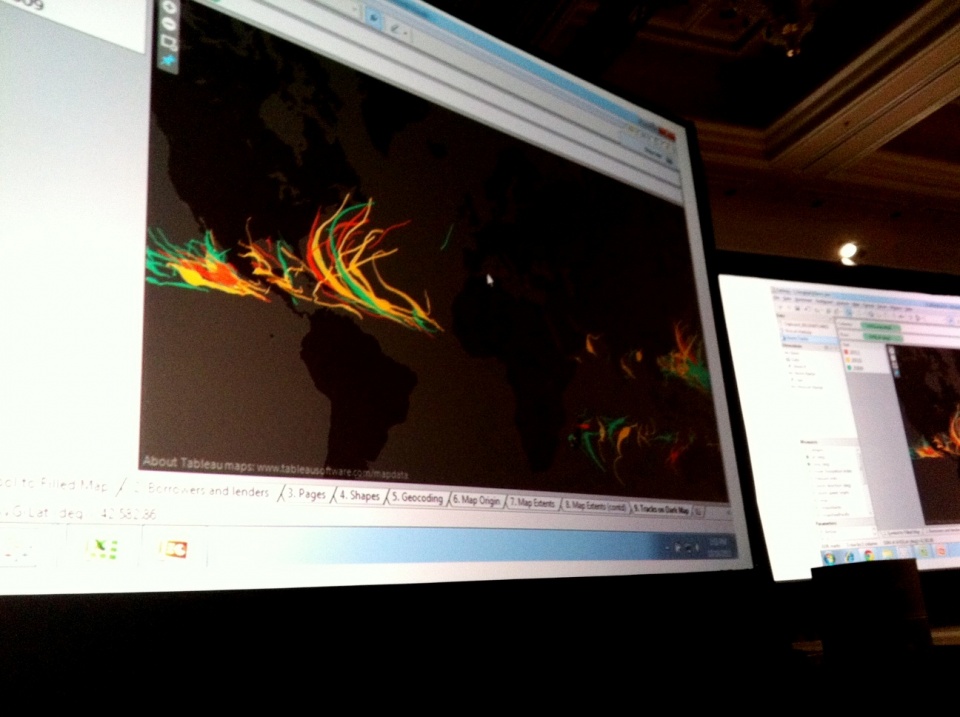
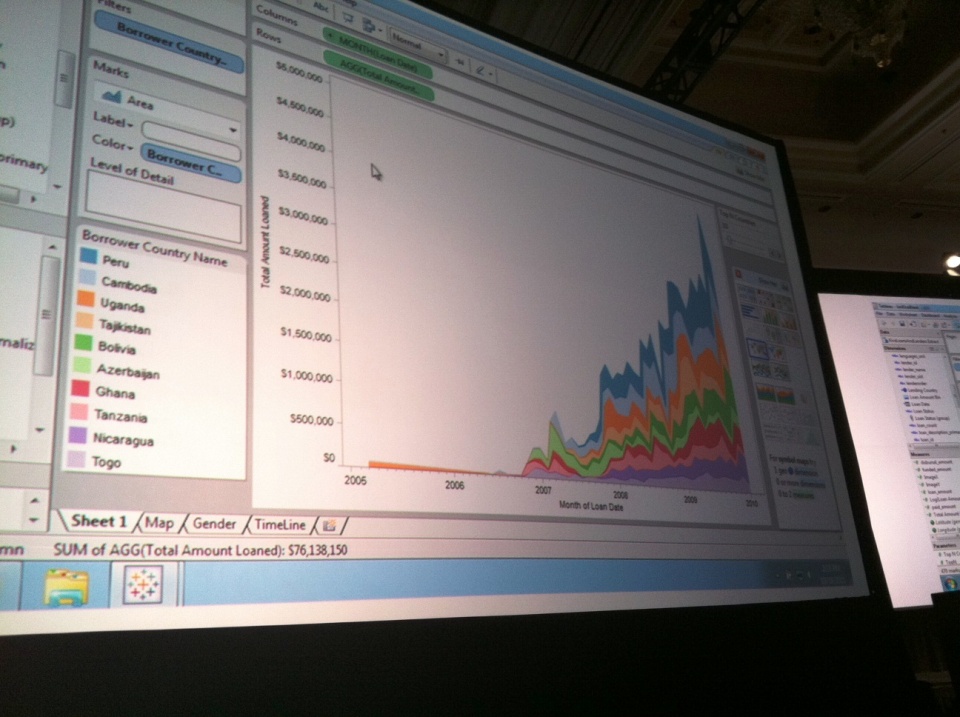
1) Ian showed a Kiva demo. Kiva is a micro-finance lender operating worldwide. The demo is based on Hadoop data.
a. Improved tooltips
i. Keep/Remove items and View Data features appear on tooltips
ii. Tooltip default text is much easier to read
b. Dual-axis maps allow the use of multiple mark types on the same locations
c. Tableau maps now use map cutouts that fill in the entire state
i. The map shapes can also be used in other view types such as text tables
2) More geocoding and mapping enhancements including a demo of dirty data about the 75 best restaurants in the world
a. In this data, Britain is no longer “Great”, instead it was in the data as “Britain”. This was one of many mis-spellings.
b. Geocoding in Tableau 7 adds synonyms for place names and pattern matching so that the best match is often selected without user intervention.
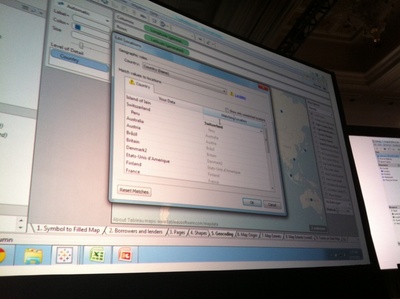
Geocoding dialog is now much smarter and more powerful!
c. Tableau automatically places almost all items on map despite poor spelling and even foreign spelling of places.
d. Unknown places are no longer placed at the 0 latitude / 0 longitude location. Instead, a simple message appears in the bottom right of the map specifying how many places are unknown. When you click this message, you have the option to fix these items.
e. While geocoding, you can add custom latitude and longitude while correcting unknown locations. This is very useful for locations not in the geocoding database.
e. You can now scroll the world map to center on the Pacific Ocean or anywhere else in the world. The map scrolls continuously instead of ending at the Internation Date Line.
f. A new feature has been added to automatically center the map based on geographic center of your data.
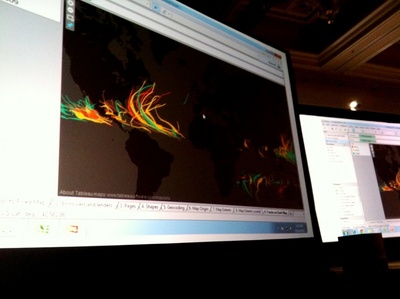
Ultra-cool dark background maps with hurricane history data
Steve Pellegrin
Analytic features for time analysis. Demonstrated with 50 M records for US airlines on time status and flight cancellations.
1) Continuous date/time hierarchy is now available as a supplement to the default discrete line charts
From this
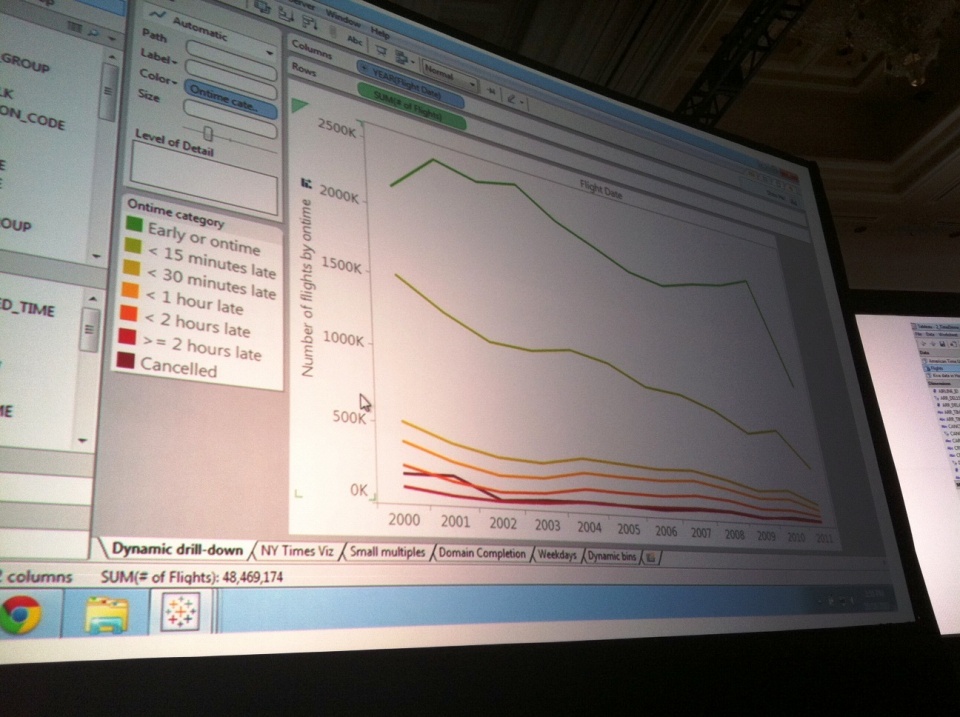
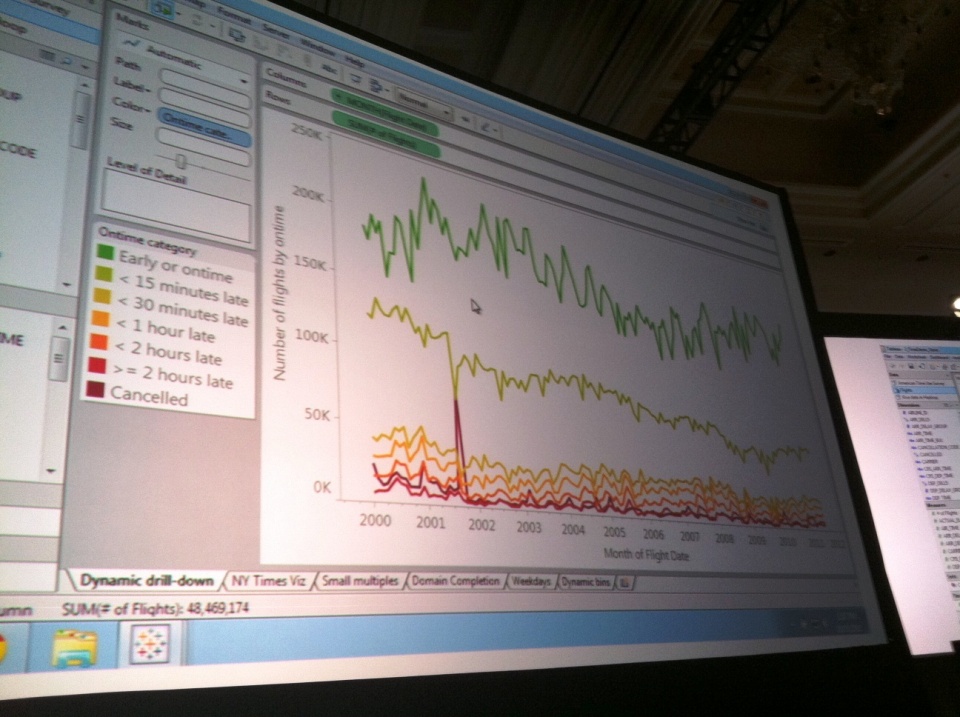
To this

Here, you can see the 9/11 effect when many flights were cancelled
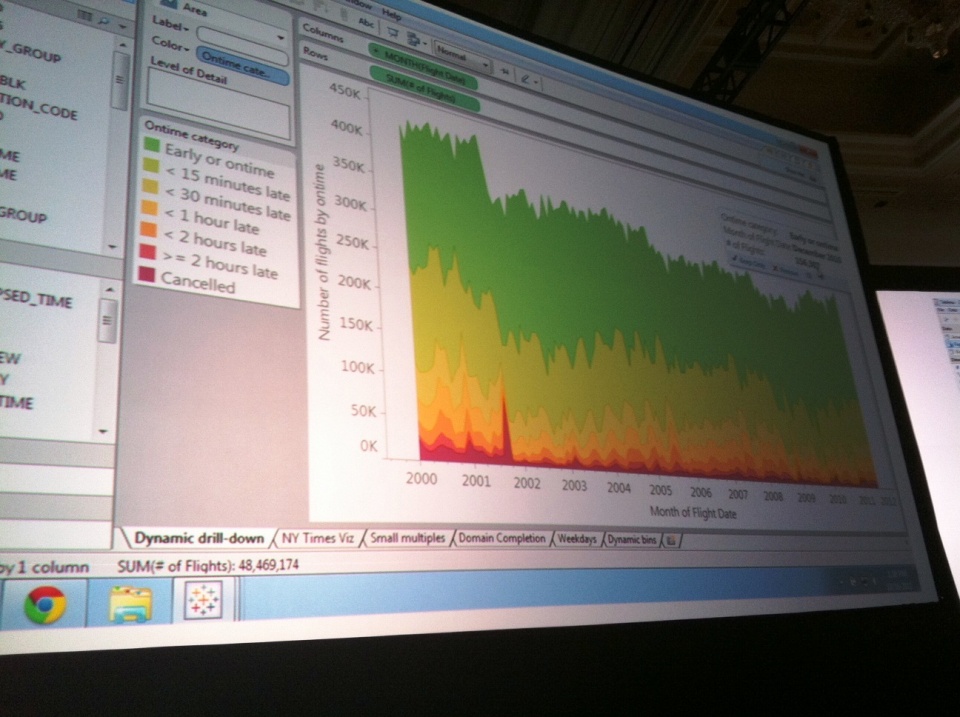
Additionally, the next view, an area chart uncovers additional insights
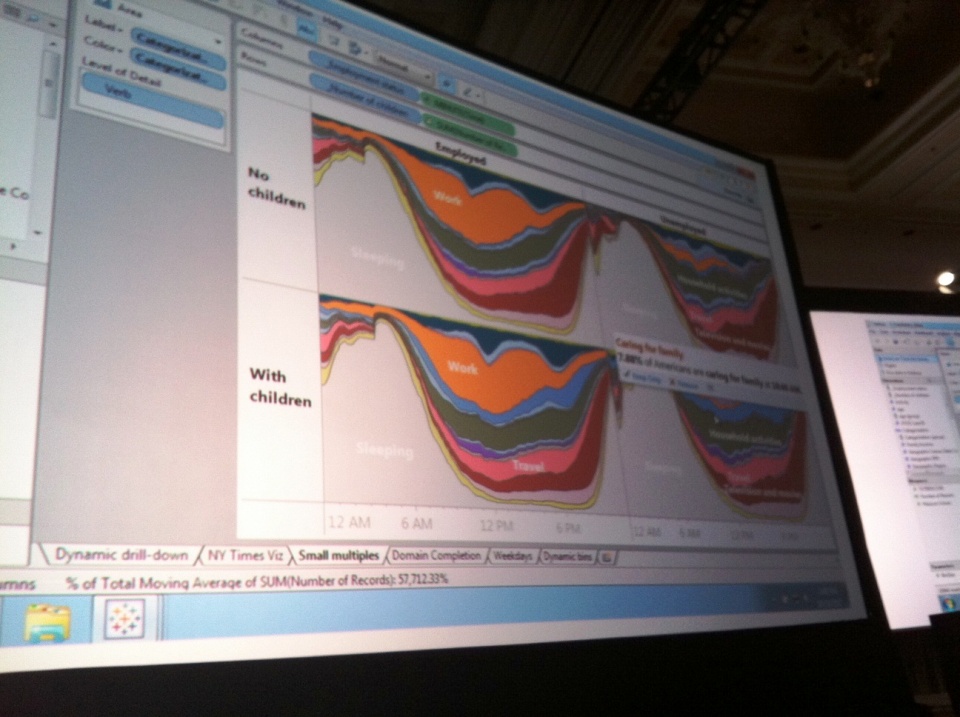
2) How people spend their daily hours
a. Area charts now added to Tableau 7
b. Small multiples area chart was demonstrated

In this area chart,
you can see a significant, persistent decline
in overall flight volume post 9/11

Small multiples example of how people spend the average day
Small multiples used to compare
Married/Unmarried and No children/With children
Data from the New York Times
3) Better visual appearance of missing values in time based data
a. You can now enhance discrete date views like a bar chart to properly space out for sparse data by day.
b. Easily show missing data by day, month, week, day of week, year
4) Parameters available for use in even more dialogs. Now available in almost every relevant dialog such as bins
Jun Kim– Customer since Tableau version 1.0 and previously at Microsoft Xbox
Now works in User Experience at Tableau
1) Show Me enhancements
a. Show Me remains open by default so you can quickly change views and
b. Informs you how to select the needed data items to build a desired view
c. Bar charts now default to horizontal

New area chart with Show Me pane on the right
2) Specify from a selector in the view how many top or bottom items to display using parameters
a. Easily pick top 10/15/20 with a slider control
3) Dashboard enhancements
a. New Dashboard is now a top-level menu item
b. Adding or moving items in the dashboard clearly show how much space they will take and where they will drop on dashboard
c. Easily resize elements including an automatic snap to align sizes with other elements
4) Jun wrapped up with a story about a game developer colleague from Microsoft that spent their free time analyzing data instead of playing video games. If a tool is so compelling that people would rather use it instead of playing video games, how much ROI will you have with this type of tool?
James Baker
1) Expanded interaction capabilities when using dashboards from Tableau Server
a. Moved operations to tooltips such as Keep/Remove items
2) By improving interactivity there is now a much shorter Server toolbar at the top of your content, with half of the items removed and now available close to their logical location of use.
Tooltip enhancements on Tableau Server
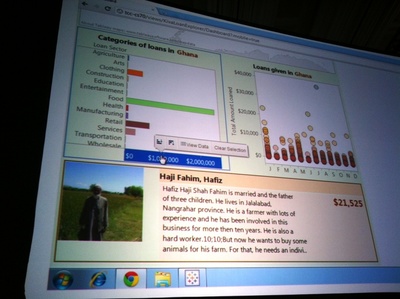
Dashboard exploring Kiva loans
You can sort, view data and clear selections from the tooltip

3) Tableau Mobile
a. One step publish to desktop, server mobile and iPad
b. Finger-friendly controls
c. A single-press will bring up the tooltip for the location of interest
Jeff Solomon
New Tableau Data Server and other data support
1) Added support for Hadoop and SAS
2) Data permissions control and embed credentials now available for server-based data sources
3) You can locally override settings from server data sources in your workbook
4) When a server-based data source is updated, you don’t need to close the workbook to see the new definitions. Simply refresh the data to use changes!
5) A new feature has been added to replace any data source with any other data source! (e.g.- from Excel to SQL Server or from a test database to a production database.)
6) One more advantage of the new Data Server is that no local PC data drivers are required for multiple databases such as Oracle, SQL Server and others.
Chris Wilkins (? not sure about last name?)
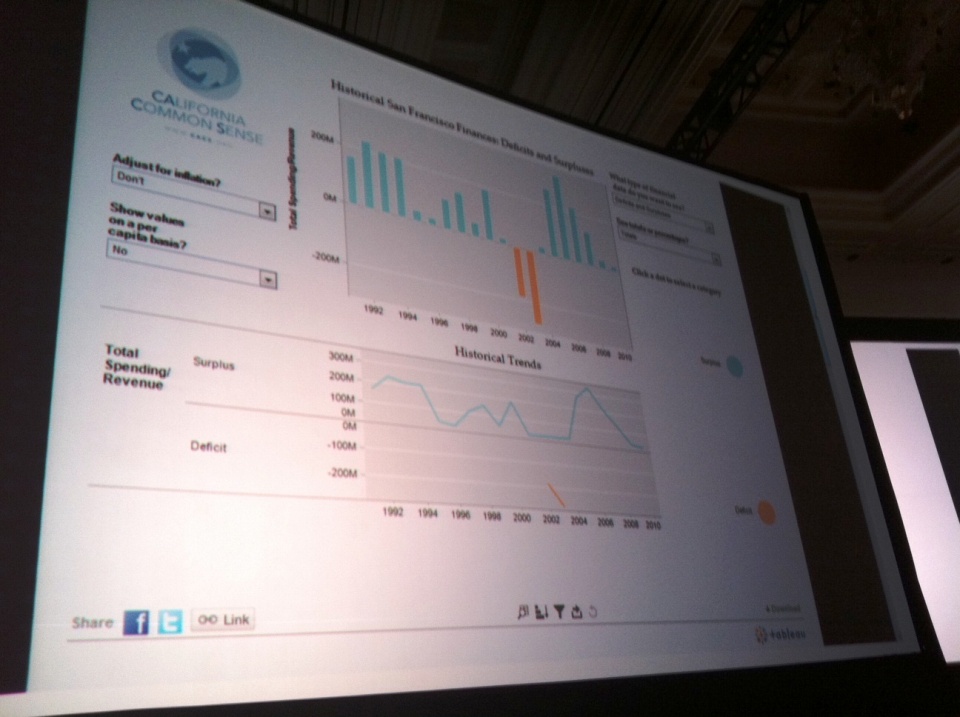
Tableau Public is adding several new features in a release of Tableau Public past the Tableau 7.0 release. Among these new features:
a. Easily share with Twitter or Facebook
i. Embeds viz and nice image
ii. Shares viz at your last view status (drill-downs, filters, etc.)

Tableau Public is now more social
Share to Twitter, Facebook and “Like” it
Securely share R shiny apps
Develop R shiny apps
All on one dedicated, secure and powerful platform.