Product summary and download links for Tableau Software desktop products

Tableau has three desktop products available for download. The last two are absolutely free for anyone to use!

Tableau Desktop is the full-featured version of the revolutionary visual data analysis software. Connect to almost any data source to explore, visualize and quickly gain insights. Wrap it all up with dynamic, easy to create dashboards! Go to
Read more

A response to the TDWI article, “An Imperative to Build, Not Buy, Agile BI”

As TDWI and vendors catch on to the success of “Agile BI” being created with products like Tableau, I find the need to reply to the idea that the same old technology will work in this new world.   This article from TDWI energized me to write a response to this frequently cited idea.   In case you aren’t familiar with the acronmym “BI”, it simply means business intelligence, typically referring to traditional tools like Cognos, Business Objects, Excel, Microstrategy, SAS and many other products.  

What is Agile BI?  
“Agile BI” is new-found jargon that describes what

Read more

SAT performance versus school spending dashboard

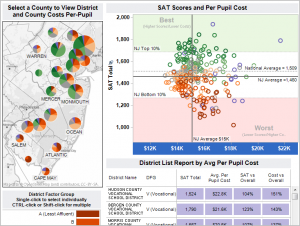
This dashboard provides a comparison of per student spending with performance on the SAT exam based on the 2009 New Jersey Report Card data. DFGs are based on economic and demographic data. These are assigned by the New Jersey State Department of Education.

This work was created in collaboration with Bob Morrison of Quadrant Arts Education Research. Bob has extensive experience with helping school systems measure educational results related to how and where funds are spent. I have a great admiration for Bob as a passionate advocate for growing both music and arts education. Bob has expertise in advocating on behalf of students around the many ways that music and arts education can engage students and improve their academic performance.

Read more

Creating a data-driven culture in your company

A great summary of key requirements to build a data-driven culture, by Chris Stolte, Tableau co-founder: 1. Don’t fear the user, 2. Encourage corporate curiosity, 3. Manage to the outliers, 4. Measure, experiment and then measure again, and 5. Build trust and understanding. I would add two more points, one of which Chris is too … Read more

Tips—Multiple Tableau Dashboard Data Sources

The setup
You have connected to more than one data source in your Tableau workbook, for example, your sales database in Oracle and a customer call database in SQL Server.   Tableau seamlessly allows you to connect to multiple data sources in one workbook.   Views developed from both data sources can be placed in a single dashboard.

However, if you try to use global filters or quick filters to synchronize the two data sources, you will find that it isn’t possible; only one data source can be linked to either.   In fact, the term “Global” filter in Tableau can be confounding, since it is only global to views using the current data source.   Global filters will not work with other data sources even if the data items have the same name!

The solution
As of Tableau 5.0 (released in 2009), a new feature

Read more