The setup
You have connected to more than one data source in your Tableau workbook, for example, your sales database in Oracle and a customer call database in SQL Server. Tableau seamlessly allows you to connect to multiple data sources in one workbook. Views developed from both data sources can be placed in a single dashboard.
However, if you try to use global filters or quick filters to synchronize the two data sources, you will find that it isn’t possible; only one data source can be linked to either. In fact, the term “Global” filter in Tableau can be confounding, since it is only global to views using the current data source. Global filters will not work with other data sources even if the data items have the same name!
The solution
As of Tableau 5.0 (released in 2009), a new feature called “Actions” enables powerful dashboard control capabilities with minimal effort. Using Actions, you can easily synchronize multiple data sources in a single dashboard with an action type called “Filter”. You can access Actions from the Edit menu.
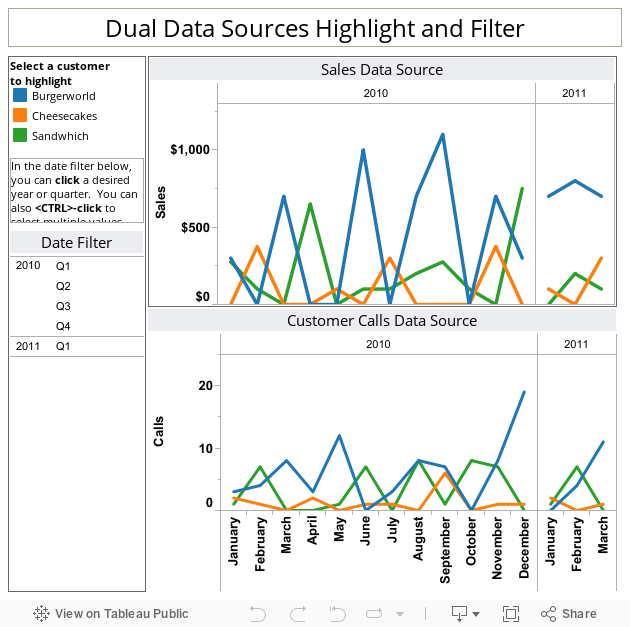
Suppose you would like to synchronize the two data sources by Year and Quarter. In the following example, I created a simple Text Table view of the Year and Quarter of data being used in the first data source. This assumes that the dates in this data source are the ranges of primary interest. Using a Filter Action, you can synchronize the two data sources based on user actions in the Text Table. Download and examine the workbook to see how this was done with my sales and customer call sample data sources.
More from Freakalytics
Freakalytics is the premier Tableau training partner, offering public and on-site training worldwide.
Subscribe to receive our newsletter and receive exclusive content.
Consider buying the first book on Tableau, “Rapid Graphs with Tableau Software” at Amazon. One reader’s review, “Well written, easy to use book that has something for everyone.” The reviewer at Tableau stated, “A great work — this is going to be a much loved book.”
Check out our white papers and webinars created in partnership with Tableau (one more here.)
Please visit our contact page if we can be of help with dashboard development, Tableau implementation, Tableau optimized data warehouse development or with general analytic strategy and visual analytics best practices development.
Securely share R shiny apps
Develop R shiny apps
All on one dedicated, secure and powerful platform.