My experience with data analytics-Strata Conference

Please join me at the Strata Conference/Hadoop World in New York next Tuesday, October 29th, as I talk about my years of experience with data analysis alongside the founders and executives of ClearStory Data. ClearStory Data is delivering a new solution that makes it simple for business users to find, combine and interactively analyze data … Read more

A Share the Data client project plan

Stephen McDaniel, Chief Data Officer AdvisoryHere’s an actual Share the Data project.  This is a simplification of a plan developed with a real client, with details changed to remove any identifying information.  While every project is unique, this is not an unusual engagement. Share the Data engagements range in length from 3 days to several weeks, depending on project complexity and client resource availability.

Background 

The client is approaching a key turning point in their operational history- going beyond traditional reporting with mainframe technologies to an advanced data warehouse with web-based reporting, dashboards, self-service analytics and even advanced analytics to optimize customer recruitment, operational management and improve the overall customer experience.

All of these areas are a dynamic, iterative undertaking with each area interlinked and interdependent.  It is critical that the management team at the client work to prioritize, fund and support each iterative phase of these projects.  Likewise, it is imperative that each phase of these projects show an acceptable rate of return (or greater!) for the time and money invested in these initiatives.  Better data and analytics are not an end in themselves, but rather a means to a more profitable and competitive company.

Objective
Read more

Tableau futures—seamless access to your data

From the 2013 Tableau Customer Conference!

Seamless Access to the Data—coming in Tableau 8.1 and 8.2

Nothing else matters if you can’t get your data into Tableau. This was a common refrain I have said for quite some time, Tableau is irrelevant if regular business people can’t figure out how to get the data into the product. In fact, it is a very frustrating experience.

Tableau states that cleaning, integrating and reshaping your data should be available as visual operations. You shouldn’t need to learn SQL to manage it.

A new data connection interface was demoed. Earlier this year, I contributed to the vision and feature debates for this area as part of a talented team of people at Tableau. This team included Jun K, Dan C, Jock M, Chris S, Richard and several other great people. Here’s an example flow:

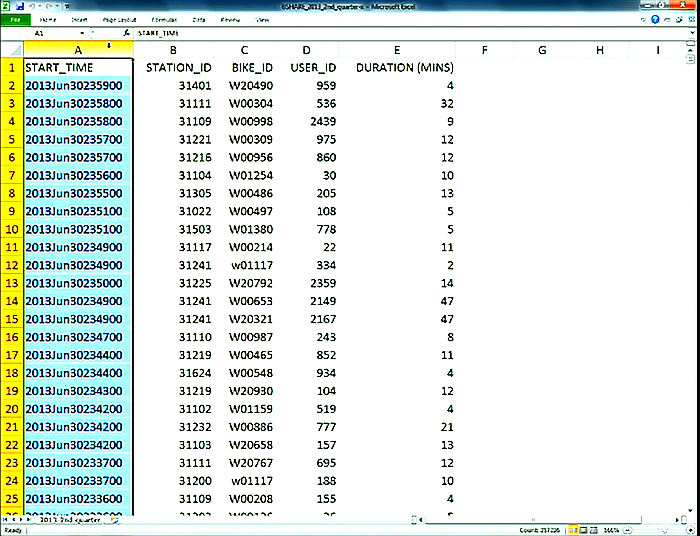
1) You have some data about bike rentals.  It’s in Excel or a text file and looks like this.  A bit rough-column names in all caps, start_time is a text field and some other important data isn’t in this file.

1_Seamless_Access_Data_001


Read more

A brief history—Freakalytics and Tableau—since 2008

Stephen and I are frequently asked the story of why we wrote the first book endorsed by Tableau Software and how we launched their original, in-person training program back in 2009. In fact, we have been asked about this so many times, I decided it would be worthwhile to share the details.

2008
Stephen first discovered Tableau Software while working at Netflix. He was so impressed with the visual analytic capabilities of the product that after working with it for a couple of years, he approached the executives at Tableau about writing the first book on Tableau, which was still a tiny company at the time. They were excited about the idea so we met with CEO Christian Chabot, CDO and Co-founder Chris Stolte and several other executives to discuss the book content.

July 2009
Stephen completed and published the first edition of Rapid Graphs with Tableau Software just in time for the Tableau Customer Conference in Seattle. Marc Rueter, now a Senior Director at Tableau and Technical Reviewer of the book, wrote

“A great work- this is going to be a much-loved book.”

Read more

Free Tableau 8 e-book at the TCC Alteryx Pavilion!

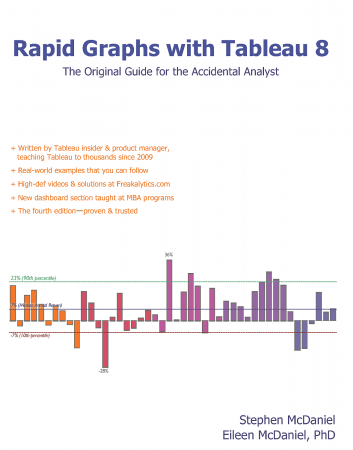
RGTS 8 Book Cover Front 1500Visit the Alteryx Pavilion at Tableau Customer Conference 2013 in Washington, DC next week to learn more about the value of Strategy Analytics and Alteryx for Visual Analytics.  Notably, attendees can pick up a complimentary USB key with Visual Analytics Best Practices including work by Freakalytics and the key even includes a preview of Rapid Graphs with Tableau 8 and a coupon code for a free copy of the e-book! Note that you must redeem your code by September 18th, 2013.

This is the original guide to Tableau for The Accidental Analyst®.  Now in its fourth edition, this is the best-selling book on Tableau, trusted by thousands including many Tableau employees who learned Tableau from it- both before and after joining the company!  Back in 2009, Elissa Fink (CMO at Tableau) wrote about Rapid Graph with Tableau Software 5, “A must read for anyone interested in Tableau. Clear explanations, practical advice and beautiful examples!”  Just a few months ago, the Marketing team at Tableau ordered bulk copies of Rapid Graphs for their new customer acquisition program, reiterating their excitement over the four editions of this book!

Read more

Free Webinar—Analyzing Your Data With Excel:
Simple Steps for Actionable Results

Webinar_Freakalytics_Excel_Analytics_2013_small_spend
Recorded August 22nd, 2013

Do what you can with what you have where you are.
—THEODORE ROOSEVELT
Cowboy, soldier, historian and
26th President of the U.S.

Synopsis
Answer everyday business questions like an analyst with Microsoft Excel. This webinar is based on a selected set of techniques from The 7C’s of Data Analysis, as covered in our book, The Accidental Analyst: Show Your Data Who’s Boss. An abbreviated case study will be used to demonstrate common techniques that can start you on the course to analyzing data with Microsoft Excel 2007, 2010 or 2013.

This presentation is approximately 1 hour and 15 minutes in length.

Read more

Tableau Online Total Cost of Ownership Calculator

Stack_Money_Flickr_artist_in_Doing_NothingWith our new cost of ownership calculator, you can estimate the number of Tableau Desktop, Tableau Desktop Pro, Tableau Online and Tableau Reader (free!) licenses to obtain for your specific needs. You can even calculate one-year and three-year estimates of cost to have Tableau at your organization, purchase consulting services and train your team.
To illustrate, the 3 Year Total Cost of Ownership, consulting and training inclusive, for a department of 30 is around $45,000. A larger deployment to a business unit with 500 people would total approximately $696,000. A 3 person company could get by for just $12,500. Start using our calculator now and make a smarter choice about your analytic investment!

Read more

Free Webinar—Quick & dirty analysis with Tableau
in 13 lucky steps!

6_Manual_Rearrange_Items_Freakalytics_1_Tableau
July 31st, 2013, Noon Pacific, 3 PM Eastern, 8 PM London
 
 
So much data, so little time!
–Stephen McDaniel
Co-founder of Freakalytics


Synopsis
Let’s face it: in the daily world of work, you often are asked to provide an answer to a new problem in less than a day. Of course, your boss tends to forget about the other three project deadlines you are currently facing, so you really have only 10 or 20 minutes to squeeze in a quick and dirty analysis.

If this sounds familiar to you, this webinar will walk you through the thirteen flexible steps that can take you from being clueless to looking smart with Tableau in just a few minutes. Hopefully you’ll be able to obtain enough information to come up with ideas for an e-mail update or talking points for the unexpected meeting that is looming large over your day, showing your boss and colleagues that you can deliver great results in time to be useful.

So, if you’re already a user of Tableau, this webinar will guide you in the critical path of many analyses in Tableau. If you are totally new to Tableau, you can see the possibilities of what you can accomplish in a short amount of time, once you get started and practice these techniques.
 
 
A preview of the first few steps

1 What question will you examine?

1_PostIts_Flickr_Sources_CC_License


Okay, in reality this step might take hours or even days! But let’s assume you have your question, and if it is complex, break it down into several, simpler questions.

2 Grab the closest, readily available dataset

Read more

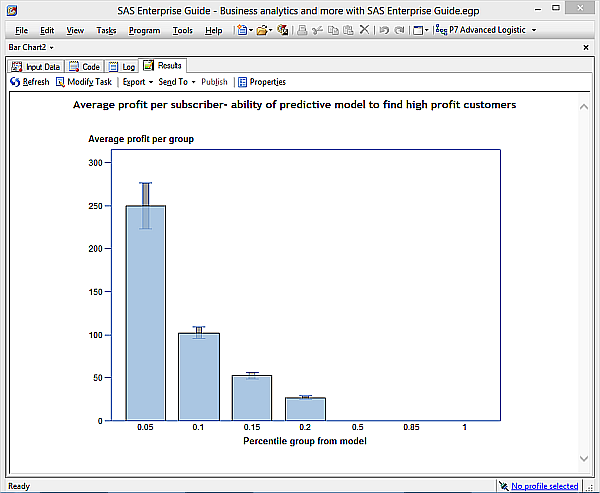
Free Webinar—Business analytics and more
with SAS Enterprise Guide

 
Recorded on July 10th, 2013
 
 
Business_analytics_SAS_Enterprise_Guide_predictive_model_600
 
 
True genius resides in the capacity for evaluation of
uncertain, hazardous, and conflicting information.

–WINSTON CHURCHILL
Prime Minister of England during WWII


Synopsis
In this webinar, Stephen will analyze multiple real-world case studies using SAS Enterprise Guide by following the 7 C’s of Data Analysis. He will collect data from a range of sources, explore the data for common problems, apply quick data fixes, demonstrate best practices of visual analytics and use powerful predictive models that go beyond the limits of standard analysis techniques.
Click here for the full post and to register below

Read more

Free Webinar—Visual Analytics Best Practices
Why Can’t You See My Point?!?

201306-Freakalytics-Nuclear-Power-602

You can have brilliant ideas,
but if you can’t get them across,
your ideas won’t get you anywhere.

-Lee Iacocca


The webinar is past but you can watch the recording and view the slides below.
This post is currently being updated with the slides and videos.

Why do visual analytics best practices matter?

Why can’t people see your point when you present data-oriented presentations?

Whether you are using big data, small data or summarized data that has been prepared for you, this webinar will explore these vital questions. If you are concerned with getting the most from your data, this complimentary webinar is a great step in learning how to clearly communicate with people as they make better informed decisions in the hectic world of modern business.

Read more