
July 31st, 2013, Noon Pacific, 3 PM Eastern, 8 PM London
So much data, so little time!
–Stephen McDaniel
Co-founder of Freakalytics
Synopsis
Let’s face it: in the daily world of work, you often are asked to provide an answer to a new problem in less than a day. Of course, your boss tends to forget about the other three project deadlines you are currently facing, so you really have only 10 or 20 minutes to squeeze in a quick and dirty analysis.
If this sounds familiar to you, this webinar will walk you through the thirteen flexible steps that can take you from being clueless to looking smart with Tableau in just a few minutes. Hopefully you’ll be able to obtain enough information to come up with ideas for an e-mail update or talking points for the unexpected meeting that is looming large over your day, showing your boss and colleagues that you can deliver great results in time to be useful.
So, if you’re already a user of Tableau, this webinar will guide you in the critical path of many analyses in Tableau. If you are totally new to Tableau, you can see the possibilities of what you can accomplish in a short amount of time, once you get started and practice these techniques.
A preview of the first few steps
1 What question will you examine?

Okay, in reality this step might take hours or even days! But let’s assume you have your question, and if it is complex, break it down into several, simpler questions.
2 Grab the closest, readily available dataset
that is relevant to your question.

Connect to Data from the Tableau home screen.

In the ideal world, your dataset is in good form, so you can just open it and move on to the next step.
If it’s in bad shape, that’s relevant information to tell your boss.
The webinar video
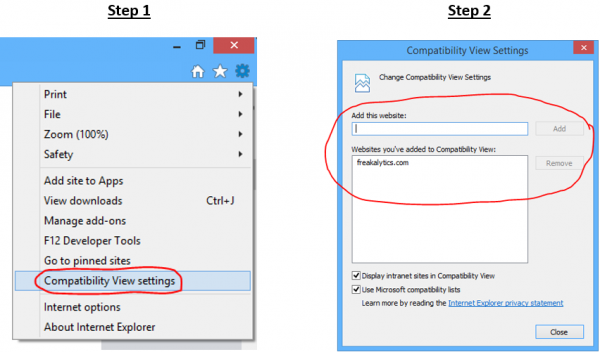
Internet Explorer requires compatibility mode to view the videos at Freakalytics. On newer versions of Internet Explorer, click the IE gear icon in the upper-right for menus, select Compatability View settings. A dialog appears where you should add freakalytics.com to your Websites you’ve added to Compatability View list.
On older versions of IE, click the broken page icon at the far right of the address bar
![]()
Video Index
01:28 – about this session
04:55 – Step 1 – Define the question
06:35 – Step 2 – Relate to the audience
08:45 – Step 3 – Pull data
10:18 – Applying the first three steps in a case study
+ Identifying the question(s) that should be answered with data
+ You need to -know- the audience to relate to the audience!
+ Only after we know the questions and the audience can we make a smart choice about what data to pull!
22:13 – Step 4 – Create basic chart
24:45 – Applying step 4 in the case study
+ Select data items and Show Me
+ Bar chart – don’t forget to sort the data!
+ Line chart – drill down on dates
+ Bullet graph – is the black line the target? If not, use the hidden Swap Reference Line Fields feature
31:38 – Step 5 – Adjust data items
32:52 – Step 6 – Filter data
34:11 – Applying steps 5 and 6 in the case study
+ Manually rearranging data items
+ The filter shelf
+ Quick filters for sharing
42:50 – Step 7 – Improve legends
43:25 – Step 8 – Add labels
43:43 – Step 9 – Emphasize key data
44:29 – Step 10 – Write useful titles and captions
45:07 – Applying steps 7 through 10 in the case study
+ Right-click on legends to adjust
+ Click the labels button on Marks card
+ Right-click on a mark in the view to annotate
+ Click Shape button on Marks card for shape adjustments (you may need to switch top of Marks card from Automatic to Shape)
+ Worksheet menu -> Show Title
52:37 – Step 11 – Repeat with different data items
53:34 – Step 12 – Compile results – DON’T include everything you’ve done!
(the demo was limited at this stage due to time constraints, a limited demo occurs)
56:54 – Step 13 – Offer recommendations – know your audience and compiled results come together in this last, often-overlooked step.
58:00 – Visual analytics references
1:02:12 – Question and answer section
The presentation from this webinar
Use the controls to navigate. On touch-screens, you can swipe to navigate. Click on the slide to advance, click the four squares in the controls for the thumbnails to appear and click the four-way arrows for full-screen viewing. While in full-screen viewing mode, you can use the right/left arrow keys to advance/go back or simply swipe right and left on touch-screens. Use the ESC key or x in bottom control-bar to exit full-screen mode.
[portfolio_slideshow include=”9846,9847,9848,9849,9850,9851,9852,9853,9854,9855,9856,9857,9858,9859,9860,9861,9862,9863,9864,9865,9866,9867,9868,9869,9870,9871,9872,9873,9874,9875,9876″]Enjoyed this? Please subscribe to our newsletter and share it!
We are a two-person, independent analytics company. Creating great content takes an enormous amount of time! You can support us by subscribing below and sharing this webinar with friends and colleagues. Thanks!
Subscribe to our newsletter