From the 2013 Tableau Customer Conference!
Seamless Access to the Data—coming in Tableau 8.1 and 8.2
Nothing else matters if you can’t get your data into Tableau. This was a common refrain I have said for quite some time, Tableau is irrelevant if regular business people can’t figure out how to get the data into the product. In fact, it is a very frustrating experience.
Tableau states that cleaning, integrating and reshaping your data should be available as visual operations. You shouldn’t need to learn SQL to manage it.
A new data connection interface was demoed. Earlier this year, I contributed to the vision and feature debates for this area as part of a talented team of people at Tableau. This team included Jun K, Dan C, Jock M, Chris S, Richard and several other great people. Here’s an example flow:
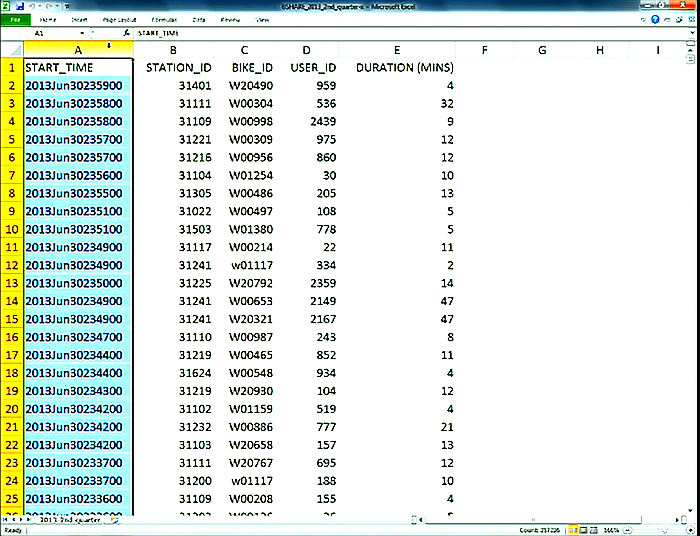
1) You have some data about bike rentals. It’s in Excel or a text file and looks like this. A bit rough-column names in all caps, start_time is a text field and some other important data isn’t in this file.
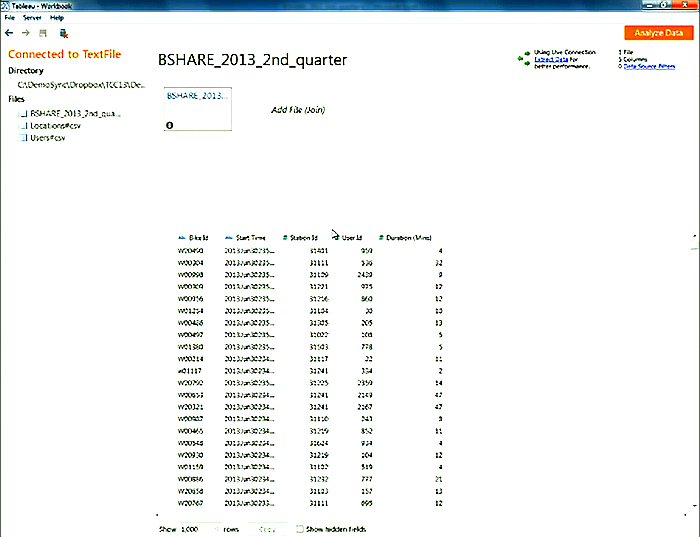
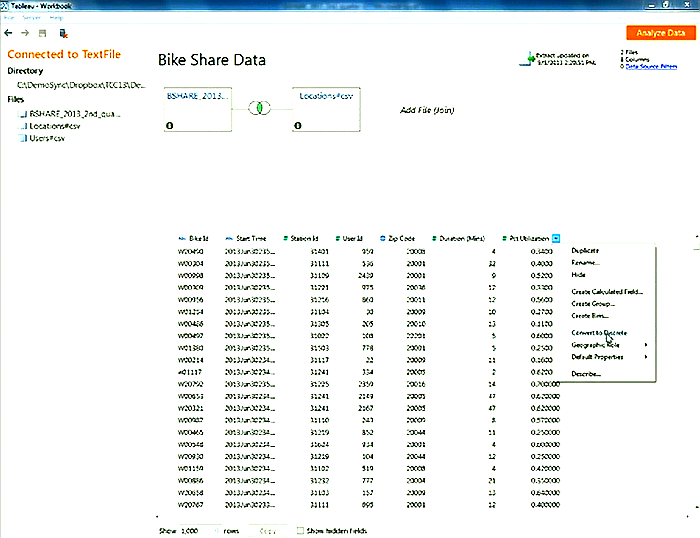
2) Once you open this data, you will see a new interface in Tableau. The directory you opened data from is shown in the upper left, the text files that may be of interest are shown below that, the data you selected is shown in the top middle, a preview of the data is automatically shown below, and some important possible actions are shown in the upper right.
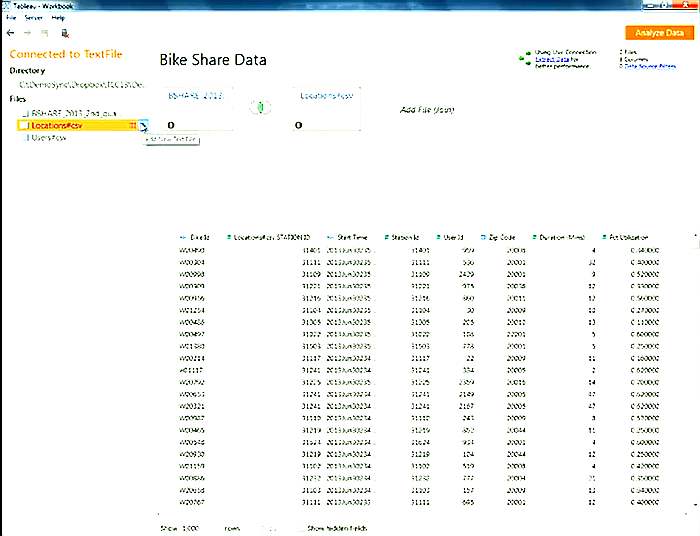
3) You realize that some other data needed for your analysis is in another data file, so you add it to the window. Tableau automatically attempts to join this data to the 1st table-shown visually at the top with overlapping circles (Venn diagram) indicating an inner join will occur by default (only data rows that match by the join fields will be kept for your analysis!)
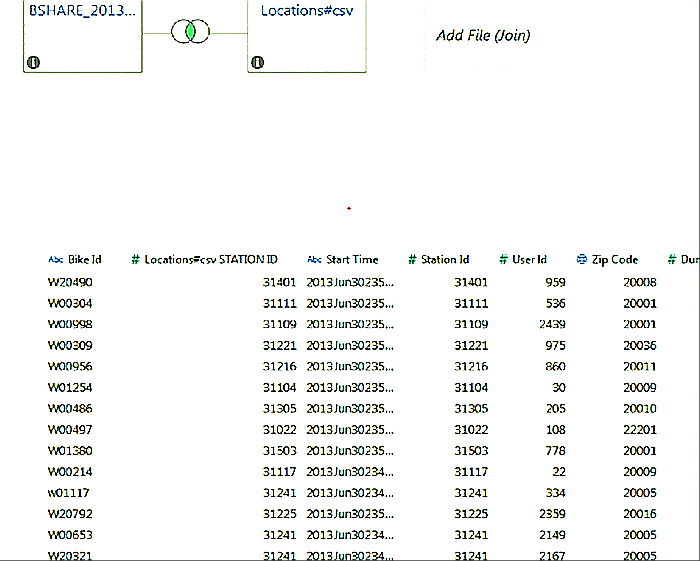
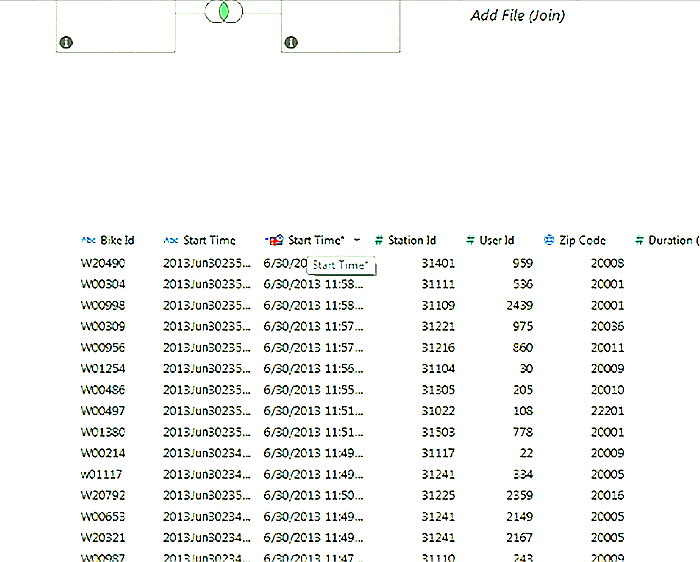
Here’s a close-up of the join with the combined data preview below.
4) You can manage individual data items from the column headers in the data grid. This allows you to instantly preview your formatting, new calculated fields, groups, bins, etc.
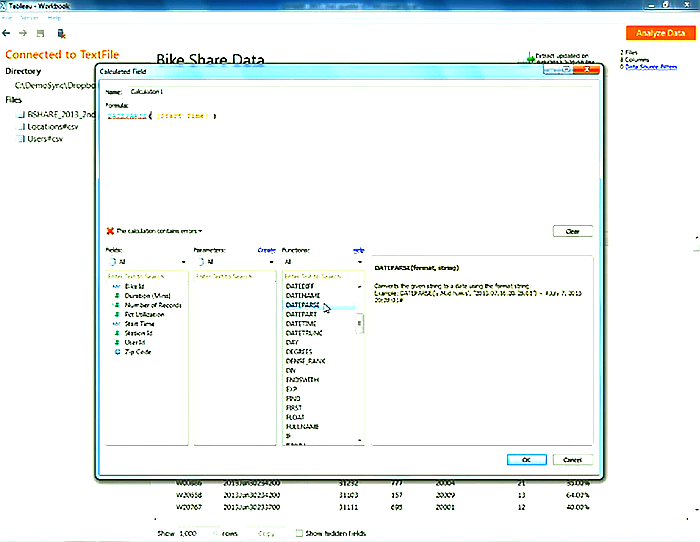
5) To cleanup garbled dates and times that are text, a new function has been added for converting dates based on a “mask”. In this function, you simply identify the format of column like this “yyyymmddhhmmss” (year, month, day, hours, minutes and seconds) or any other variant like this “mmmddyyyy”. Chris Stolte said it should eventually be entirely visual, you wouldn’t even need to create a calculated field (as shown in this example).
5) Hooray! Our cleaned up text field is now a useful date/time field. Being Tableau, date hierarchies are very important (and built-in), so this is a very common conversion that is now much easier.
Miscellaneous notes of other improvements coming to Tableau in this area.
1) Visually build and clean the data.
2) Auto-cleaned the data for usability, for example, this data was changed to mixed case column headers for easier reading.
3) This is not just the beginning, you can easily return to the data management phase in the middle of analyzing your data to add another table, clean it, etc.
4) Even more data connectors will continue to be added, including unstructured data sources.
Securely share R shiny apps
Develop R shiny apps
All on one dedicated, secure and powerful platform.