 Who said that analytics can’t be a fun way to start your day@f25 Tableau animated our dashboard at https://freakalytics.com/snp-pub-freak/ and set it to the music of Journey! Awesome job Tableau and a great way to kick-off the conference!
Tableau 6 – how it can change your world
The following article features Tableau 6
Whether you are exploring your data for new insights, answering specific questions or even deciding what questions to ask, Tableau gives you unprecedented control to investigate, communicate and take action with the valuable information hidden in your data! Tableau has it all – a wide variety of options to graph your data, the ability to adjust your data so that you are using the right data in the right form for the questions at hand, and a user-friendly interface that’s designed around how people think about analysis, allowing you to follow your thoughts as you question and explore your data. You can work with every major data source, from Excel workbooks to the largest databases. You can even extract data from larger sources into a local “extract” file that will make your data exploration more efficient and allow offline analysis when you are away from the office.
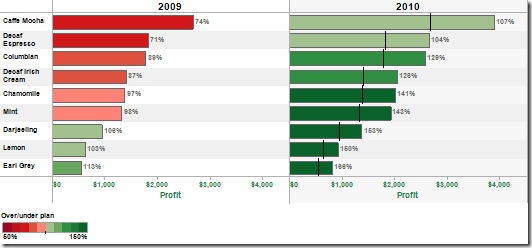
Profit and planned profit by product
Red is below plan, green is above
Percentage is actual versus plan
Black line in 2010 shows prior year profit amount

Displaying profit versus sales by region and customer segment Average profit ratio = size of bubble;
Minimum and maximum percents labeled per region
Colors are customer segments
State of Washington government salaries from 2010, search all 160,000 employees
State of Washington government salary information is now available at WashingtonGovernmentSalaries.com. The dashboard is fully searchable by agency, job title and employee using a dashboard developed by Freakalytics and hosted by Tableau Public. Both companies are based in Seattle, Washington. Freakalytics specializes in expert, in-person analytics training and popular books on analytics. Tableau is a … Read more
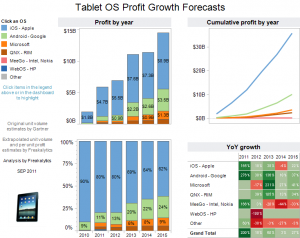
iPad & tablet competitors profit estimates through 2015 – building on Gartner unit estimates
 GigaOM’s recent article on the growth of the iPad and overall tablet-related OS market inspired me to take their forecasts one step further- actual profit estimates through 2015 per major player in the article.
My forecasts are indeed rough, but attribute higher and lower profits to the various vendors based on the nature of their product, likely price point and direct or indirect control they will have over the actual distribution of their platform. For example, Android is expected to be heavily partnered for their distribution (the upcoming Kindle is just one example), this implies lower profit per unit. Meanwhile, Apple with their early market lead and total control over the tablet sales implies higher profit per unit sold. Regardless, these are rough estimates, but fascinating to consider. Most incredible
Helping a social media expert- just 30 minutes with Tableau
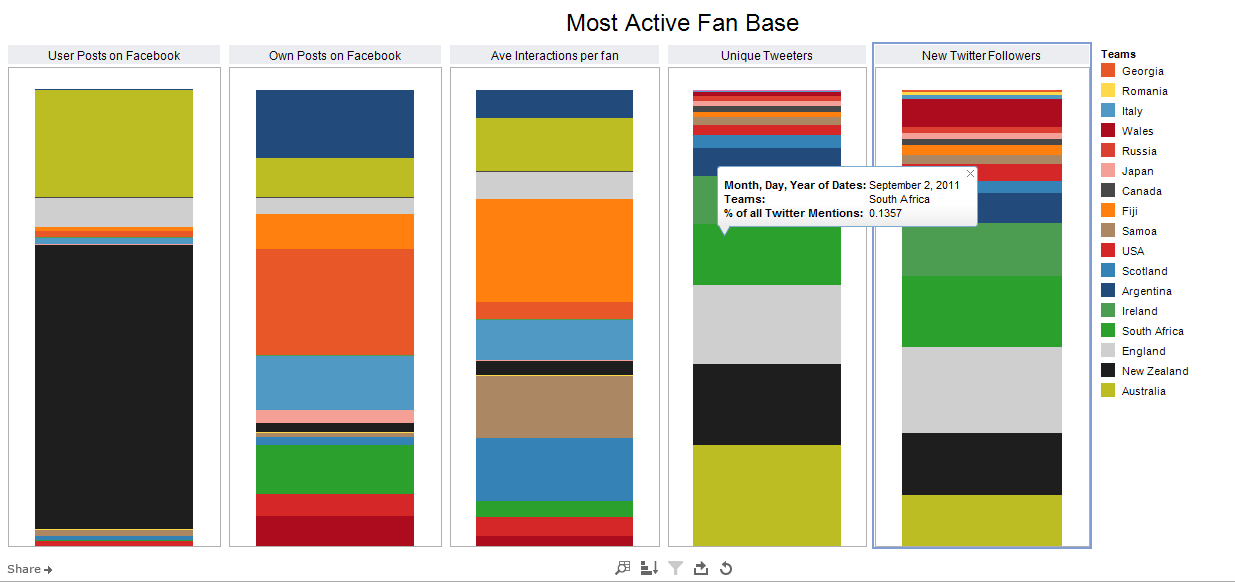
While working hard on a busy weekend, I decided to take a “break” from our upcoming book and client work to spend 30 minutes to help and surprise a newer user of Tableau- social media expert Justin Flitter of New Zealand. He is new to Tableau Public and had started off with a look at some social media metrics by country. Here is a snapshot of his initial work:

After reviewing his initial workbook
US Federal Government Debt- Which Presidents have managed it best since 1970?
We just launched a new website to share analysis of this critical topic at http://www.usdeficitstats.com/.
Buy a copy of The Accidental Analyst at a book seminar
Please use this link only if you are buying a copy of the book from us in person. All other requests will be refunded. If we aren’t in the same place with you at a seminar with books on hand, please go here to order it on Amazon. To buy 1 copy $29.00 USD2 copies … Read more
Tableau file types- purpose, features and limitations
TWB – Tableau WorkBook file 1) A text file, to be more specific, an XML file, which is a highly structured text file that contains a) Data connection information b) View layout definitions c) And thumbnails or snapshots of each view TWBX — Tableau packaged WorkBook file 1) Everything contained in a Tableau WorkBook … Read more
Dashboards podcast for journalists- ideas & examples with Journalytics
Episode Overview: Hosted by Journalytics, we discuss the utilities and pleasantries of Data Visualization and Dashboards. During our conversation we discuss several specific examples of dashboards in the news. Click here to listen.