
July 31st, 2013, Noon Pacific, 3 PM Eastern, 8 PM London
So much data, so little time!
–Stephen McDaniel
Co-founder of Freakalytics
Synopsis
Let’s face it: in the daily world of work, you often are asked to provide an answer to a new problem in less than a day. Of course, your boss tends to forget about the other three project deadlines you are currently facing, so you really have only 10 or 20 minutes to squeeze in a quick and dirty analysis.
If this sounds familiar to you, this webinar will walk you through the thirteen flexible steps that can take you from being clueless to looking smart with Tableau in just a few minutes. Hopefully you’ll be able to obtain enough information to come up with ideas for an e-mail update or talking points for the unexpected meeting that is looming large over your day, showing your boss and colleagues that you can deliver great results in time to be useful.
So, if you’re already a user of Tableau, this webinar will guide you in the critical path of many analyses in Tableau. If you are totally new to Tableau, you can see the possibilities of what you can accomplish in a short amount of time, once you get started and practice these techniques.
A preview of the first few steps
1 What question will you examine?

Okay, in reality this step might take hours or even days! But let’s assume you have your question, and if it is complex, break it down into several, simpler questions.
2 Grab the closest, readily available dataset
Read more
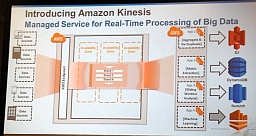 Amazon wades into big data streams with Kinesis
 Finding it hard to make time to keep up with the rapidly changing world of data, data warehousing, analytics, data science, business intelligence and visual analytics? We understand! Here’s our curated summary of relevant news that could help with your future data and analytic projects.
  How Big Data Is Changing Science (and Society)
 Whether you are a CIO, data architect, or a data management professional, it is imperative to understand the different approaches, attitudes and needs of the next generation of data warehouse consumers. Traditional data warehouse users include reporting teams, BI teams (who created reports for the rest of the company), statisticians and others. In the past few years, this has been rapidly changing with the new roles of data scientists, the rise of Data Enthusiasts and the burgeoning population of Accidental Analysts. In Part 1 of this series, we focus on successful collaboration between data scientists and data warehouse teams.
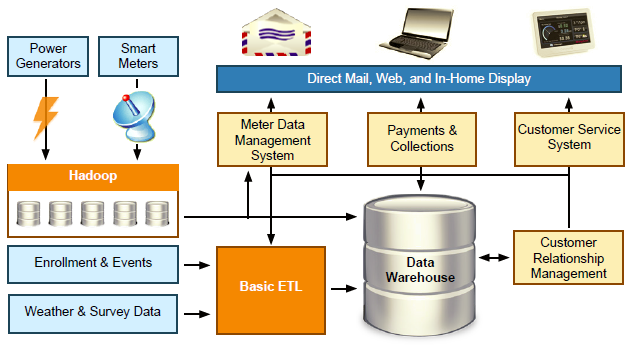
 Here’s an actual Share the Data™ project. This is a simplification of a plan developed with a real client, with details changed to remove any identifying information. While every project is unique, this is not an unusual engagement. Share the Data™ engagements range in length from 3 days to several weeks, depending on project complexity and client resource availability.
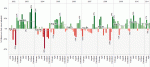
 Bullet charts were added to Tableau in version 5.1. They are an original idea designed and advocated for by Stephen Few, at the University of California at Berkeley. The bullet chart is intended to enable easy examination of attainment relative to a target for categorical items.