Tableau file types- purpose, features and limitations

TWB – Tableau WorkBook file 1) A text file, to be more specific, an XML file, which is a highly structured text file that contains a) Data connection information b) View layout definitions c) And thumbnails or snapshots of each view   TWBX — Tableau packaged WorkBook file 1) Everything contained in a Tableau WorkBook … Read more

Wimbledon winners longevity, by years since 1st win
small form-factor

Learn About Tableau         Freakalytics is the exclusive source of the original Complete Tableau Training (4 days) and our new course, Data Management and Visual Analytics with Tableau (2-days).   For a detailed review of Tableau features, pricing and capabilities, visit PowerTrip Analytics.   For the Tableau Online pricing calculator, click here.

Wimbledon winners by ranking (seed) and gender, small form-factor

Learn About Tableau         Freakalytics is the exclusive source of the original Complete Tableau Training (4 days) and our new course, Data Management and Visual Analytics with Tableau (2-days).   For a detailed review of Tableau features, pricing and capabilities, visit PowerTrip Analytics.   For the Tableau Online pricing calculator, click here.

Wimbledon winners dashboard- small form-factor dashboard example

      Freakalytics is the exclusive source of the original Complete Tableau Training (4 days) and our new course, Data Management and Visual Analytics with Tableau (2-days).   For a detailed review of Tableau features, pricing and capabilities, visit PowerTrip Analytics.   For the Tableau Online pricing calculator, click here.

Why in-person Complete Tableau training by Freakalytics?

Everyone is busy and overloaded. People find it hard to add new techniques and tools into their daily work due to extensive demands in almost every level of every company. People are trying to do more with less, faster and better!

Why should you take off four valuable days to attend Tableau training by Freakalytics?

We were fortunate to have a distinguished attendee recently write-up her four-day training experience. Susan Kistler is Executive Director of the American Evaluation Association, an organization dedicated to assessing the strengths and weaknesses of programs, policies, personnel, products, and organizations to improve their effectiveness. AEA has approximately 5500 members representing all 50 states in the US as well as over 60 foreign countries.

Here is part of her review:

There is no substitute for learning at the feet of a master. And I’m not just saying this because I coordinate training for AEA. I’d been using Tableau Software for months.

Read more

Quick reference for graph and dashboard design

Freakalytics has published a quick reference for building better graphs and dashboards. The Rapid Dashboards Reference Card has 64 tips readily available on four full-color, laminated pages. The card serves as a handy reference for yourself, your team and even your business audience during design meetings. Page 1 Excerpt, buy it at Amazon Page 3 … Read more

Bullet charts and simple enhancements to maximize value

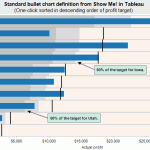
Bullet charts were added to Tableau in version 5.1. They are an original idea designed and advocated for by Stephen Few, at the University of California at Berkeley. The bullet chart is intended to enable easy examination of attainment relative to a target for categorical items.
 
According to Stephen’s original specification, “The bullet graph was developed to replace the meters and gauges that are often used on dashboards. Its linear and no-frills design provides a rich display of data in a small space, which is essential on a dashboard.

I have shown the standard Tableau bullet chart and a wide array of variants in our public training course. Based on extensive attendee feedback, I will share how just a few minutes spent enriching your bullet charts will yield powerful enhancements for your dashboard audience.
 

Read more