A dashboard to select high-quality stocks with high yield and low volatility

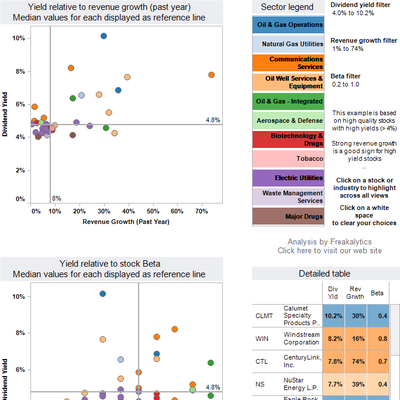
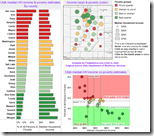
High yield high growth low beta dashboard by Freakalytics 2011 12 squareSelecting a “safe” stock with a solid dividend is quite popular in the current economic climate. The traditional “safe” investments are paying extremely low interest rates while many American companies are growing revenues while paying out strong dividend yields (4% and higher) that exceed those of government bonds. In late December, I selected a set of stocks with solid financial strength ratings, positive revenue growth in the past year, dividends of 4% or more and lower than average stock price volatility (also called the beta of a stock.)  


After some data cleanup, I assembled this into a dashboard for quick review and exploration. This dashboard allows you to select higher yields, higher revenue growth or lower levels of volatility. By clicking on an individual stock, you are taken to MSN Money web site (below initial dashboard) for their current “StockScouter” rating.
 

Read more

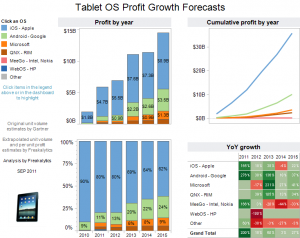
iPad & tablet competitors profit estimates through 2015 – building on Gartner unit estimates

GigaOM’s recent article on the growth of the iPad and overall tablet-related OS market inspired me to take their forecasts one step further- actual profit estimates through 2015 per major player in the article.
 
My forecasts are indeed rough, but attribute higher and lower profits to the various vendors based on the nature of their product, likely price point and direct or indirect control they will have over the actual distribution of their platform. For example, Android is expected to be heavily partnered for their distribution (the upcoming Kindle is just one example), this implies lower profit per unit. Meanwhile, Apple with their early market lead and total control over the tablet sales implies higher profit per unit sold. Regardless, these are rough estimates, but fascinating to consider. Most incredible

Read more

Helping a social media expert- just 30 minutes with Tableau

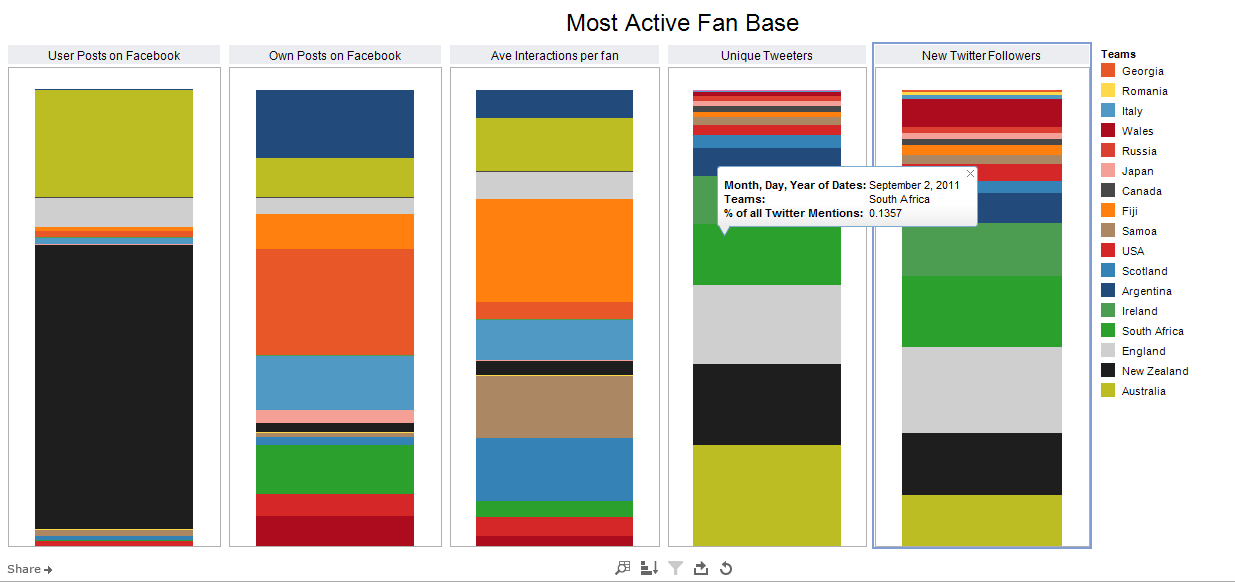
While working hard on a busy weekend, I decided to take a “break” from our upcoming book and client work to spend 30 minutes to help and surprise a newer user of Tableau- social media expert Justin Flitter of New Zealand. He is new to Tableau Public and had started off with a look at some social media metrics by country. Here is a snapshot of his initial work:


After reviewing his initial workbook

Read more

MIT Sloan Review, don’t allow pies to obscure the “New Intelligence” you hope to share

MIT Sloan Review, don't allow pies to obscure the New Intelligence you hope to share

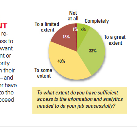
I was very interested to read the survey results from MIT about data access challenges facing business analysts. The article states that “The New Intelligent Enterprise… will allow you to do some immediate benchmarking – and see how your organization is doing in relation to your peers.” While I am certain the data from this survey can indeed be useful in meeting their objective, I am also certain that their initial chart selection makes this difficult to easily see and understand.


In an effort to demonstrate how they can make their upcoming report much more informative

Read more

Wimbledon winners longevity, by years since 1st win
small form-factor

Learn About Tableau         Freakalytics is the exclusive source of the original Complete Tableau Training (4 days) and our new course, Data Management and Visual Analytics with Tableau (2-days).   For a detailed review of Tableau features, pricing and capabilities, visit PowerTrip Analytics.   For the Tableau Online pricing calculator, click here.

Wimbledon winners by ranking (seed) and gender, small form-factor

Learn About Tableau         Freakalytics is the exclusive source of the original Complete Tableau Training (4 days) and our new course, Data Management and Visual Analytics with Tableau (2-days).   For a detailed review of Tableau features, pricing and capabilities, visit PowerTrip Analytics.   For the Tableau Online pricing calculator, click here.

Wimbledon winners dashboard- small form-factor dashboard example

      Freakalytics is the exclusive source of the original Complete Tableau Training (4 days) and our new course, Data Management and Visual Analytics with Tableau (2-days).   For a detailed review of Tableau features, pricing and capabilities, visit PowerTrip Analytics.   For the Tableau Online pricing calculator, click here.