TCC EU 2011- Data Visualization with Stephen Few

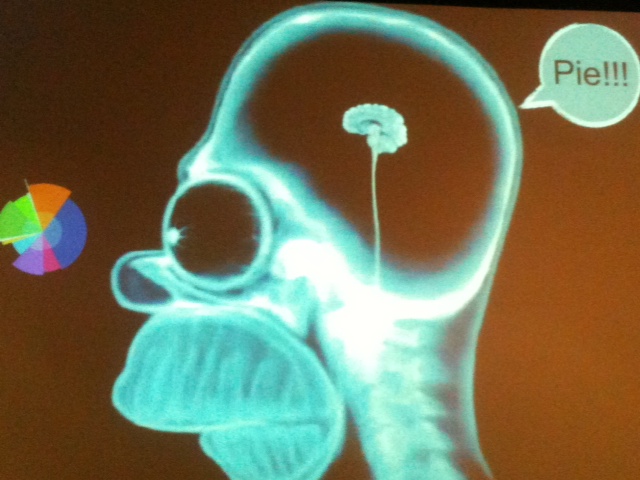
Pie charts by Homer, the real reason everyone loves pie, it isn't the ability to see the data...

Stephen Few, Author, Founder of Perceptual Edge and Lecturer at University of California at Berkeley

Some comments are the opinion of Freakalytics and not
necessarily those of Tableau or Stephen Few

This content is live blogged; there may be occasional errors or omissions.


Overview

There is no way to easily weave data into knowledge…
Are we enlightening our audience or frustrating our audience?
Data and the use of data are the sexy jobs of the next decade

A video with Hal Varian at UC- Berkeley and Google was shown in an interview
– Managers should be able to examine the data themselves
– Old organizations required armies of people for leaders to see the data
– Instead, we should enable access to the data for everyone
Read more

TCC EU 2011- Premier of Tableau 6.1- Developers on Stage

Chris Stolte, Chief Development Officer, Tableau (co-founder, Tableau Software)- on-stage
Dan Jewett, VP of Product Management
Francoise Ajenstat, Director of Product Management

Some comments are the opinion of Freakalytics and not necessarily those of Tableau

This content is live blogged; there may be occasional errors or omissions.
 
 
Overview

Mission of dev team- “Help people see and understand their data.”
Make data fun
, anathema too many, but key to using data throughout the organization and entire decision-making process
 
 
Four key areas of investment for 6.1

Data performance
Sharing via mobile optimization with iPad
Localizing and globalizing the products- French and German
User experience- make every step easy, fast and fun!

Read more

TCC EU 2011- Tableau Server Scaling and Performance Best Practices

With Dan Jewett, VP of Product Management, Tableau
(Dan and Stephen previously worked together at Brio in the late 90’s)

Some comments are the opinion of Freakalytics and
not necessarily those of Tableau

This content is live blogged; there may be occasional errors or omissions.
 
 
Overview

Architecture
Hardware
Server config
Database or data engine@f21
Workbook optimizations for Server publishing

Read more

Why in-person Complete Tableau training by Freakalytics?

Everyone is busy and overloaded. People find it hard to add new techniques and tools into their daily work due to extensive demands in almost every level of every company. People are trying to do more with less, faster and better!

Why should you take off four valuable days to attend Tableau training by Freakalytics?

We were fortunate to have a distinguished attendee recently write-up her four-day training experience. Susan Kistler is Executive Director of the American Evaluation Association, an organization dedicated to assessing the strengths and weaknesses of programs, policies, personnel, products, and organizations to improve their effectiveness. AEA has approximately 5500 members representing all 50 states in the US as well as over 60 foreign countries.

Here is part of her review:

There is no substitute for learning at the feet of a master. And I’m not just saying this because I coordinate training for AEA. I’d been using Tableau Software for months.

Read more

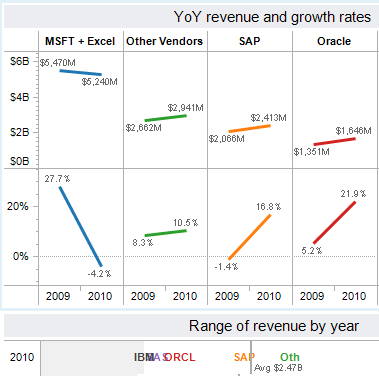
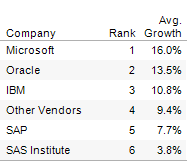
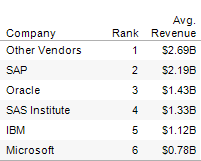
The growth of the traditional analytics vendors, 2008-2010 (Gartner and other data sources)

Growth rate
Winners- Microsoft, Oracle and IBM
Laggards- SAP and SAS

Market share
Winners- SAP, Oracle and SAS
Laggards- IBM and Microsoft

Growth combined with market share (using three-year ranks)
Winners- Oracle, SAP and Microsoft tied at 2nd
Laggards- IBM and SAS

From the recent Gartner press release, “There was little change year-on-year in terms of vendor rankings. SAP remained the No. 1 vendor in combined worldwide BI, analytics and PM software revenue in 2010, accounting for 23 percent of the market (see Table 1), followed by Oracle, SAS Institute, IBM and Microsoft.” I find this fairly interesting since the vast majority of companies I work with all cite Excel as the most frequently used analytics tool, by a long-shot. For more details on this thought, please review our second analysis that includes Excel in the “Analytics” market.

Without further delay, here is a dashboard summarizing the results, we have added data from 2008 for additional context and insight.

Read more

Quick reference for graph and dashboard design

Freakalytics has published a quick reference for building better graphs and dashboards. The Rapid Dashboards Reference Card has 64 tips readily available on four full-color, laminated pages. The card serves as a handy reference for yourself, your team and even your business audience during design meetings. Page 1 Excerpt, buy it at Amazon Page 3 … Read more

Rapid Graphs for Tableau Software 6 book data download

If you are looking for the complimentary book preview and table of contents, please follow this link.

Rapid Graphs with Tableau Software 6There are three sample datasets used in the Tableau 6 book that are free for anyone to use, but you must be a registered user of our site to access these downloads. Registration connects us with you so we can e-mail you 2-3 times per year with course schedules, book updates and other topics of interest. You may unsubscribe from the e-mail list at anytime by visiting our home page and clicking on the unsubscribe link. Please note that we will never share this registration information with another company.


Read more