Where is the authoritative Tableau reference guide???

As you are likely aware, we wrote the first book on Tableau, “Rapid Graphs with Tableau Software“. It is intended to guide people through the overall capabilities, product flow and key features of Tableau. At 160 pages, it is an intentionally light and quick-flowing introduction to using Tableau for typical data analysis and visualization needs. A new version of the book for version 6 of Tableau will be out soon.

However, we occasionally hear from advanced users seeking an authoritative reference guide on Tableau. Given the breadth of Tableau capabilities

Read more

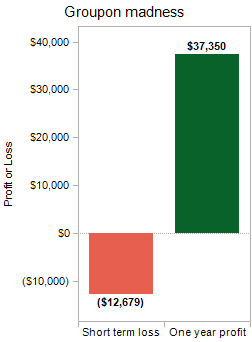
Groupon madness, estimate your short and long-term profit or loss

It seems that you can’t avoid Groupon in the news lately. Consumers are mad about using Groupon since they can find great deals at often unheard of discounts. Even for customers, there is a often a down-side with reports of customers mobbing unprepared businesses and leaving frustrated or unhappy with the experience.

My review of multiple profit estimates shows that without a high rate of repeat business, your Groupon gains will likely end up as a big loss! However, if you can handle the volume of business and are considering offering Groupon at your business, you should download my spreadsheet to estimate the short and long term profitability of your participation.

1) The example used in the spreadsheet is based on a local restaurant. Their standard entree cost is $32.55 with the Groupon deal offered at $14.79. The fee to Groupon is half of the $14.79, leaving the business with $7.40 to cover $8.90 in marginal food and staff costs.

Read more

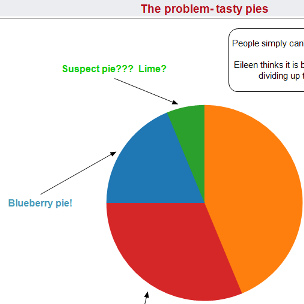
The lighter side of pie charts and bar charts

Stephen Few is famous for railing against the frequent overuse of pie charts. Overall, we agree with Stephen, pie charts are frequently misused when other chart types would likely be a superior choice for exploring and understanding the data at hand.

In our training classes we sometimes ask students why they (or their boss) prefer pie charts. The answer is typically “because”. That’s about it. They have often given little thought as to why this is their favored choice, but all the standard applications make them easy to generate and “expected” by their managers.

Eileen has pondered if the fascination with pie charts started during our childhoods. Particularly with our childhood love of pizza and dessert pies. Children often debate which piece of pie is “theirs”. As a result, it is only natural as adults to assume

Read more

Review of Tableau 6, the dawn of “Personal Business Intelligence”
Is traditional “Business Intelligence” obsolete?

Tableau 6 is a major leap forward in providing personal data analysis capabilities. I reviewed the capabilities of Tableau 6 prior to the Tableau Customer Conference 2010 and found myself stunned at the major achievements forthcoming in Tableau 6. There are several capabilities in Tableau 6 that will radically change how people think about and use data in their daily work.

These achievements will have a significant impact on analysts

Read more

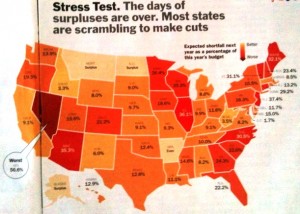
Map dashboard, state budget shortfalls for 2011, just 30 minutes with Tableau

Time magazine recently published a map of state budget shortfalls for 2011 by state. While this was a good attempt, I thought it would be informative to show this data in Tableau to offer additional insight. The image of Time’s map is not as clear as a regular scanned image since I used my iPhone- taking the photo on a flight!

There are three primary areas for improvement

Read more

“Rapid Graphs with Tableau”, free preview and how to purchase it at Amazon

The version 5 book is now out of print.
Here is where you can find out about
Rapid Graphs with Tableau 7 or Rapid Graphs with Tableau 6

Rapid Graphs Front Cover 400 500 Rapid Graphs Back Cover 400 500

Click here for a complimentary preview of the Table of Contents and Chapter 1.

Reviews of “Rapid Graphs with Tableau”
A great work — this is going to be a much loved book.
Marc Rueter- Director of Sales Consulting, Tableau Software

A must read for anyone interested in Tableau. Clear explanations, practical advice and beautiful examples…
Elissa Fink – Vice President of Marketing, Tableau Software

Back Cover Text
Tired of boring spreadsheets and data overload from confusing graphs? Master the art of rapid graphs with Tableau Software. Tableau is designed with one goal in mind – to give you the power to quickly explore and understand your data so that you can use your results in a wide variety of real-world situations. After learning Tableau, you will be able to clearly communicate your findings with audience-friendly graphs and tables.

“A picture is worth a thousand words” is a common saying that is more relevant today than ever as volumes of data multiply and the need for easy access to answers becomes more critical. From simple yet stunning graphs to vibrant multi-graph views capable of communicating incredible insights, this book will cover the extensive range of Tableau capabilities in easy-to-follow examples. Learn the scope and flexibility of this powerful application in just 15 days and go beyond the traditional limits of data presentation!

Read more

Dashboard tips by example- maps to inform, standard and novel approaches

Dashboards developed for clients frequently incorporate maps. Tableau offers quick, simple yet insightful mapping capabilities out of the box. I have noticed that many maps used in my client’s dashboards attempt to display continuous measures. Examples include sales in the past quarter, year to date expenses versus budget or number of open sales opportunities. All … Read more