Tableau Tips: Nested sorting not as expected- a simple fix

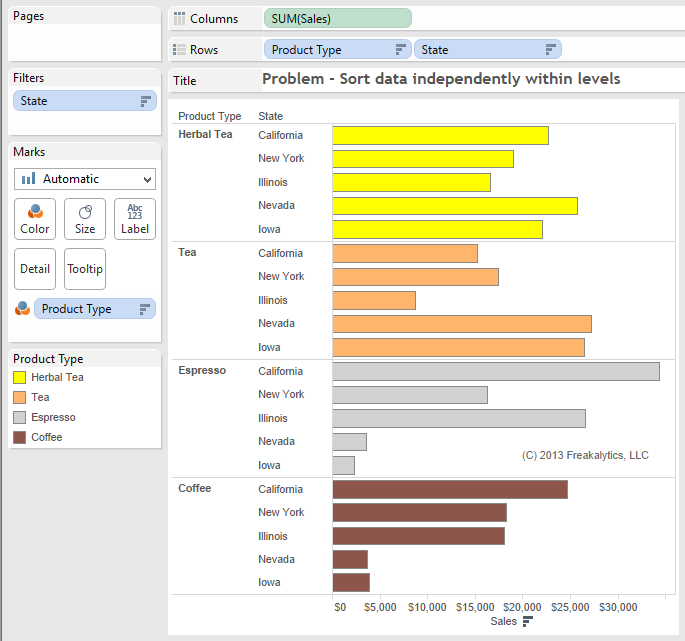
Many students have been confused about the Tableau data sort behavior.   A common question is how to sort the data at a lower level correctly within each higher level of data in a view.   One student recently came to us with this view and asked, “What’s up? I thought it would sort each state independently within each Product Type! In the first group, Herbal Tea, Nevada is clearly number one yet it is shown in the fourth position.”


Tableau_Tips_Nested_Sorting_1_Freakalytics


Solution

I replied that Tableau was sorting State overall across every product type once for the entire table and then displaying this sort order for every Product Type.   She said this is “stupid, how can I fix it! I wasted hours trying to fix it already.”

Login to see the solution including a solution workbook! If you haven’t joined Freakalytics yet, it’s free and easy.   Just click signup.

Read more

Waterfall Chart in Tableau and a Superior Alternative…

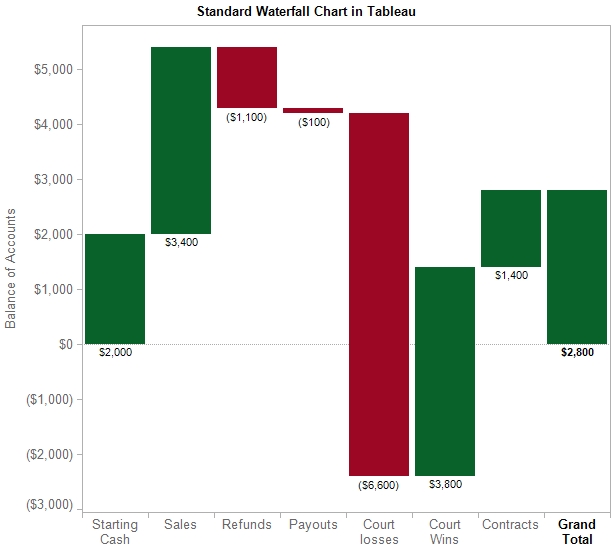
The 1st workbook walks you through building a standard Waterfall chart in Tableau. Waterfall charts are intended to show you how cash balances change over time based on transactions that either add to or subtract from the cash account of a business.

As this example demonstrates, many non-standard chart types can be created in Tableau using advanced features of the product. This chart type is a frequent request of students in our public and on-site Tableau training courses.

Standard_Waterfall_Chart_Tableau_Freakalytics

Read more

Marimekko charts and an interactive alternative for a broad audience

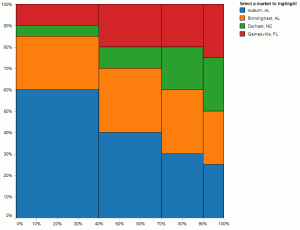
A Marimekko chart created in Tableau by Joe Mako, inspired by Jon Peltier

Joe Mako recently created a Tableau version of a Marimekko char inspired by an example from Jon Peltier, an Excel charting expert.

When I first saw this chart, I was curious as to the utility of this chart type for regular business decision-makers.   I agree that for advanced analysts, it can offer a compact, contained means to present information across two categorical items (dimensions in Tableau) and metric (a measure in Tableau.)   You can see this in the Marimekko chart created by Joe Mako in the left half of the dashboard below. When you examine the Marimekko chart you can see the dominant cities and the relative share of each segment within each city.   You can also select the city names above the view to highlight a specific city.   For example, you can easily discern that Almond Lovers are the biggest group of customers for this company and Delicious-n-new are the smallest group.

However, it is somewhat challenging to ascertain within Gainesville, FL which segment is the largest and smallest for this city.   If you hover over each Gainesville, FL value in the original chart, you will see that two segments are identical in size; this is very hard to see without the hover values.   This is due to the varying width and length dimensions for each tile in the chart.

After considering this interesting example,

Read more

From Business Intelligence to Visual Analytics
Craft a Winning Data Strategy

Stephen McDaniel and Eileen McDaniel, Ph.D. Freakalytics, LLC Topics: Data Analysis, Visual Analytics and Business Intelligence This was originally published in the TDWI FlashPoint Newsletter in August of 2014 Italicized sections, images and their captions were not part of the TDWI version. Until recently, visual analytics was considered a niche area. Those days are quickly … Read more

Build a Basic Dashboard in Tableau 8
Excerpt from Rapid Graphs with Tableau 8

Freakalytics_Dashboard_Tableau_8_BasicAppendix #2—Build a Basic Dashboard

We’ve taught entire courses on how to design and build dashboards in Tableau over multiple days, so the topic can be quite complex. In this section, you will learn the basic functionality so you can get started. For more advanced dashboards, visit www.Freakalytics.com/examples.

Dashboard Audience
VP of Sales at a cheese maker that sells to the public and to gourmet retailers

Overall Objective of Dashboard
Sales updates for monthly review by Sales Vice President (VP)

The Sales VP has four questions:
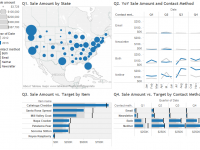
1. What are sales by state?
2. What were sales by customer contact method in 2013 compared to 2012?
3. What are the actual sales by item versus the target sales?
4. What are the actual sales by customer contact method versus the target sales?

Download the Cheese Factory sales data packaged workbook from www.Freakalytics.com/rgts8d

Included in the workbook:
Data source contains two years of sales data for 2012 and 2013.
Four worksheets with views answering the four questions above.
The final dashboard is illustrated at the end of this appendix.

Build the dashboard
Open the workbook, and in any one of the worksheets, on the main menu, select Dashboard → New dashboard. In the Dashboard pane on the left side, double-click on each of the four worksheets in the numbered order. Also in the Dashboard pane, in the Dashboard Size section at the bottom, change Desktop to Automatic so the 4 views fit within the workspace. The worksheets are arranged in the order added and the legends for Q1 and Q2 are on the right.

Adjust containers

Dashboards are comprised of containers that contain the views, legends and filters and are outlined by solid lines when you click on them. First, move the legends to the left side of the dashboard.

Read more
PowerTrip Analytics™ 2014
Candid Quadrants™
Based on three-year visual analytics cost estimates

Detailed cost comparisons across all seven visual analytics offerings at PowerTrip Analytics™ pricing review tables. Read individual product details, highlights and examples: Microstrategy Analytics Desktop, SAP Lumira, Tibco Spotfire, Microsoft Power BI, Tableau Desktop, QlikView, and SAS Visual Analytics.

Download data to predict gender using first name (US data)

Do you have data with just first names or even just first initials but no information on the person’s gender/sex? If you would like better insights on your customers, based on whether they are likely male or female, then this data download is a great way to maximize your ROI! Download it today and begin … Read more

Top News – Analysis & Commentary
Data, Data Warehousing, Analytics & BI

Five Business Intelligence Predictions
from Paxata for 2014

January 26th, 2014
Stephen McDaniel
Chief Data Officer Advisor at Freakalytics, LLC

Paxata logo blue 201401Finding it hard to make time to keep up with the rapidly changing world of data, data warehousing, analytics, data science, business intelligence and visual analytics? We understand! Here’s a top new story worth reading and that we considered noteworthy enough to add commentary and analysis by Freakalytics (in purple).  A summary of the article and excerpts that I comment on are in black.

In this commentary and analysis, we cover the growth of Tableau and QlikView, the opportunities that exist for Microsoft to disrupt the second-generation business intelligence market and how self-service data integration will likely make data scientists & data enthusiasts much more productive- enabling wide swathes of Accidental Analysts to quickly answer tactical business questions.

Five Business Intelligence Predictions For 2014 (from the CEO of Paxata)
Summary
The dust is finally beginning to clear from the big data explosion, which is a good thing. One of the problems with big data is that it’s been led by technology, not business requirements. And business requirements will be the focus in the 2014 business intelligence (BI) ecosphere—to enable enterprises to achieve results with data mining and analytics and to prove those results.

Stephen
I found this article a fascinating glimpse into the strategic thoughts of a CEO of a promising, second-generation, cloud-based data integration company- Paxata.

Read more

2014 US growth forecasts of Business Intelligence vendors

There are many ways of measuring the growth of business intelligence vendors. One approach of interest in the era of self-service analytics is to measure the growth in web search volume. Derived from web search volume data from Google, the following analyses can serve as a useful reference to understand which companies/products are growing in popularity and which may be falling out of favor.

The estimates in all of the following analyses are based on simple web search volume indices from the United States through the end of November, 2013. Using historic search volume data, forecasts were built for each company/product and growth rates for 2014 were derived from these forecasts.

I would group these companies into three categories
fast growers- Tableau, PowerPivot, Qlikview, BIRST and GoodData;
the growers- Spotfire and Microstrategy,
and mature products- Oracle BI, SAS, Cognos, SPSS, SQL Server, Actuate and Business Objects.

Read more