January 26th, 2014
Stephen McDaniel
Chief Data Officer Advisor at Freakalytics, LLC
![]() Finding it hard to make time to keep up with the rapidly changing world of data, data warehousing, analytics, data science, business intelligence and visual analytics? We understand! Here’s a top new story worth reading and that we considered noteworthy enough to add commentary and analysis by Freakalytics (in purple). A summary of the article and excerpts that I comment on are in black.
Finding it hard to make time to keep up with the rapidly changing world of data, data warehousing, analytics, data science, business intelligence and visual analytics? We understand! Here’s a top new story worth reading and that we considered noteworthy enough to add commentary and analysis by Freakalytics (in purple). A summary of the article and excerpts that I comment on are in black.
In this commentary and analysis, we cover the growth of Tableau and QlikView, the opportunities that exist for Microsoft to disrupt the second-generation business intelligence market and how self-service data integration will likely make data scientists & data enthusiasts much more productive- enabling wide swathes of Accidental Analysts to quickly answer tactical business questions.
Five Business Intelligence Predictions For 2014 (from the CEO of Paxata)
Summary
The dust is finally beginning to clear from the big data explosion, which is a good thing. One of the problems with big data is that it’s been led by technology, not business requirements. And business requirements will be the focus in the 2014 business intelligence (BI) ecosphere—to enable enterprises to achieve results with data mining and analytics and to prove those results.
Stephen
I found this article a fascinating glimpse into the strategic thoughts of a CEO of a promising, second-generation, cloud-based data integration company- Paxata.
Paxata made waves at Strata last Fall as a startup, they brought impressive customer testimonials to the conference and surprised me by securing partnerships with both Tableau and QlikView (two leading competitors in the second-generation business intelligence space.) Paxata promises to make data integration and preparation for analytic projects accessible to business experts and much faster for technical experts.
 Prakash prediction
Likely too, you’ll begin to hear the phrase “big data” less in 2014. It will become table stakes. Every company that once had a wading pool of data now has an ocean of it—so what? That is no measure of excellence. Business performance is a measure of excellence.
Stephen
I have always advised clients that business performance is what matters. I think many CIO’s have felt comfortable moving in this direction in the past few years as well, I see many more of them leaning towards business led technology decisions, especially in analytics.
I agree with Prakash about the sea of data, since many companies still have insufficient infrastructure to collect and especially to analyze both structured and unstructured data – data that can often deliver big business value. I see this changing in the next five years, but it is a slow slog since many are still struggling to keep their structured data sources (data warehouses) in good form for self-service analytic needs, much less aggressively make use of their unstructured data sources.
Prakash
Tableau and QlikView have penetrated perhaps 5 percent of the Excel market already, but the size of that Excel base is misleading. Its licenses are part and parcel of the Microsoft Office suite, and far exceed its user base. So, all things considered, Tableau and QlikView have gained more ground than 5 percent.
Stephen
I would disagree about how far Tableau plus QlikView have penetrated the Excel market, they definitely have much less than 5% of the total worldwide (WW) Excel Analytics Market (people using Excel to analyze business data) by my estimates and around one-tenth of one percent of the total Excel user base! See my “back of the envelope” analysis below, which shows Tableau plus QlikView capturing just 1.3% of the WW Excel Analytics Market and less than 0.1% of the WW total Excel user base. Additionally, based on my experience with multiple clients, most Tableau users continue using Excel extensively, just in ways that better suit Excel’s traditional strengths.
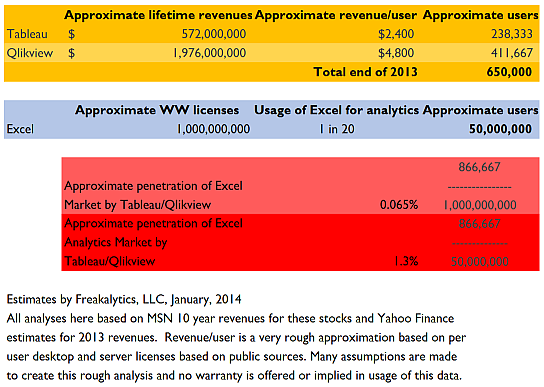
What I find fascinating in this little analysis is the fact that such a small amount of the potential market has purchased, much less adopted second-generation BI tools (full adoption typically takes 1-3 years after purchase, in my experience). This leaves big opportunities for competing second-generation BI products and a huge entry point for Microsoft, which has been investing in PowerPivot (a visual analytics product capable of working with large data sources, just like Tableau and QlikView). Unfortunately, Microsoft has crippled the growth of PowerPivot via complex licensing restrictions. If this changes (hey, a new CEO is coming to Microsoft!) they could capture significant market share by addressing this frustrating problem.
Prakash
Currently, companies spend more than $200,000 on a data scientist who ends up mostly doing data plumbing, which results in the underutilization of data scientists. In the coming year, we’ll see the amount of time spent on data preparation drop significantly from 80 percent to 40 percent, with more compression to come.
Stephen
I agree that this is a very time-consuming part of the analytics process. However, it will likely be several years before adoption of tools like Paxata, Alteryx, ClearStory Data, LavaStorm and even more effective use of traditional products like SAS Enterprise Guide will help clear the path to quicker analyses.
If Informatica decides to invest in the potential of this space, they could further accelerate the growth of this promising market. Informatica already offers a free version of PowerCenter, with a 250k row/day restriction. As a long-time user of Informatica, I respect it as the leading independent company in the data integration space, a good choice for building and maintaining enterprise data warehouses. If Informatica were to deliver the core set of their extensive functionality in a very simplified form for the desktop, while maintaining interoperability with their PowerCenter product, they would be serious competition in the nascent self-service data integration space.
Regardless of the tools, the professional judgment of the person collecting the data influences what data they select, how they will combine the data sources and even determining whether they know enough to create metrics of higher value. So, there is no panacea on the horizon, extensive knowledge will still be required, just the nature of that knowledge needed will change. In the next few years, this will broaden the group of people that can act as the data wrangler for the analytic process, which is exciting indeed!
My prediction is that data scientists and data enthusiasts will embrace self-service data integration products, even though Accidental Analysts could use them. The result will be much quicker time to analytic data stores that are specially crafted to meet specific business needs. Accidental Analysts will use these tools on occasion, but will gain higher value from consuming these customized data sources with second and third-generation business intelligence tools. It is easily worth $200k/year for a data scientist if part of their annual work enables 100-200 Accidental Analysts to easily explore and analyze their data with bespoke, well-crafted analytic data stores.
![]() Follow Freakalytics on Twitter
Follow Freakalytics on Twitter
 RSS for Freakalytics.com
RSS for new course & webinar alerts
About the editor
 Stephen McDaniel is Chief Data Officer Advisor at Freakalytics, LLC. He advises Chief Data Officers, CIOs, CEOs and CFOs on how to develop and implement successful strategies for all aspects of data utilization, from collection to integration to storage to effective analytics that lead to higher profits and happier customers. Stephen also is an experienced educator, teaching thousands of students around the world how to leverage valuable insights from their data, offering public and on-site training workshops. With 25 years of experience, he has led and provided vision for data warehousing, business intelligence and advanced analytic teams at over two hundred companies including Loudcloud, Tableau Software, SAS Institute, Brio Technology and Netflix. Stephen is co-author of The Accidental Analyst, SAS for Dummies, Rapid Graphs with Tableau, and the Rapid Dashboards Reference Card.
Subscribe to our newsletter