Why choose Complete Tableau Training by Freakalytics?
A recent attendee’s perspective

  This review of our 4 day training series was written on LinkedIn by a recent public training attendee, Danyelle.  She works at the US Department of Health and Human Services as a Senior Data Advisor.  I had the great pleasure of speaking with her  outside of the class and was fascinated to hear how … Read more

Quick tutorial on reference lines, bands and distributions – visual analytics best practices

The following article features Tableau 6

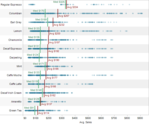
Reference lines, bands or distributions may be added to your views to emphasize particular values or areas that may be useful in interpreting your data. In particular, when comparing multiple groups or categories of data, reference lines and bands provide immediate feedback on the overall differences between the groups.

Reference lines

Reference lines are vertical or horizontal lines displayed on your view that mark requested values such as average, median, minimum, maximum, sum, total and constants (such as a line that separates the data points as being above or below a target). They can be added on any continuous axis.

1) Open the Sample – Coffee Chain (Access) data source included by default with Tableau 6

2) Place Sales on the Columns shelf and change the aggregate to Average.

3) Place Product on the Rows shelf,
     State and Date on the Level of Detail shelf
     and format
Date to ‘MMMM YYYY’.

Read more

State of Washington government salaries from 2010, search all 160,000 employees

State of Washington government salary information is now available at WashingtonGovernmentSalaries.com. The dashboard is fully searchable by agency, job title and employee using a dashboard developed by Freakalytics and hosted by Tableau Public. Both companies are based in Seattle, Washington. Freakalytics specializes in expert, in-person analytics training and popular books on analytics. Tableau is a … Read more

Quick reference for graph and dashboard design

Freakalytics has published a quick reference for building better graphs and dashboards. The Rapid Dashboards Reference Card has 64 tips readily available on four full-color, laminated pages. The card serves as a handy reference for yourself, your team and even your business audience during design meetings. Page 1 Excerpt, buy it at Amazon Page 3 … Read more

Bullet charts and simple enhancements to maximize value

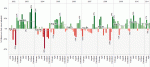
Bullet charts were added to Tableau in version 5.1. They are an original idea designed and advocated for by Stephen Few, at the University of California at Berkeley. The bullet chart is intended to enable easy examination of attainment relative to a target for categorical items.
 
According to Stephen’s original specification, “The bullet graph was developed to replace the meters and gauges that are often used on dashboards. Its linear and no-frills design provides a rich display of data in a small space, which is essential on a dashboard.

I have shown the standard Tableau bullet chart and a wide array of variants in our public training course. Based on extensive attendee feedback, I will share how just a few minutes spent enriching your bullet charts will yield powerful enhancements for your dashboard audience.
 

Read more

Product summary and download links for Tableau Software desktop products

Tableau has three desktop products available for download. The last two are absolutely free for anyone to use!

Tableau Desktop is the full-featured version of the revolutionary visual data analysis software. Connect to almost any data source to explore, visualize and quickly gain insights. Wrap it all up with dynamic, easy to create dashboards! Go to

Read more

A response to the TDWI article, “An Imperative to Build, Not Buy, Agile BI”

As TDWI and vendors catch on to the success of “Agile BI” being created with products like Tableau, I find the need to reply to the idea that the same old technology will work in this new world.   This article from TDWI energized me to write a response to this frequently cited idea.   In case you aren’t familiar with the acronmym “BI”, it simply means business intelligence, typically referring to traditional tools like Cognos, Business Objects, Excel, Microstrategy, SAS and many other products.  

What is Agile BI?  
“Agile BI” is new-found jargon that describes what

Read more

SAT performance versus school spending dashboard

This dashboard provides a comparison of per student spending with performance on the SAT exam based on the 2009 New Jersey Report Card data. DFGs are based on economic and demographic data. These are assigned by the New Jersey State Department of Education.

This work was created in collaboration with Bob Morrison of Quadrant Arts Education Research. Bob has extensive experience with helping school systems measure educational results related to how and where funds are spent. I have a great admiration for Bob as a passionate advocate for growing both music and arts education. Bob has expertise in advocating on behalf of students around the many ways that music and arts education can engage students and improve their academic performance.

Read more

Stephen Few’s latest book, “Now you see it”

Stephen’s latest book is a brilliant interplay of simple to advanced statistical concepts with powerful visual equivalents and methods. It offers wonderful guidance with great examples around visualizing time series, correlations and multivariate analysis problems. It will have a major impact for many years to come in changing how business analysts work, think and improve … Read more