November 15th, 2013
Stephen McDaniel
Chief Data Officer Advisor at Freakalytics, LLC
Finding it hard to make time to keep up with the rapidly changing world of data, data warehousing, analytics, data science, business intelligence and visual analytics? We understand! Here’s our curated summary of relevant news that could help with your future data and analytic projects. We also add commentary on the topic, a summary of the article and the link to read the full article.
There are five articles in this update:
Rapid-I data mining now RapidMiner, the Redhat of data mining?
Integrating data and mobile trumps big data for many CFOs
Bipartisan DATA Act unanimously approved by Senate Committee
Can SAS Visual Analytics replace PowerPoint?
Big data sources to consider for your company
Missed our last issue of Top News, November 11th? Stories included Big Data and Society, Data Mining Blues, 2014 INFORMS Conference, Facebook’s Free Big Data System for Analysts, Adaptive Data Preparation, How Trust Affects the Use of Analytics and Meeting a VAST Challenge
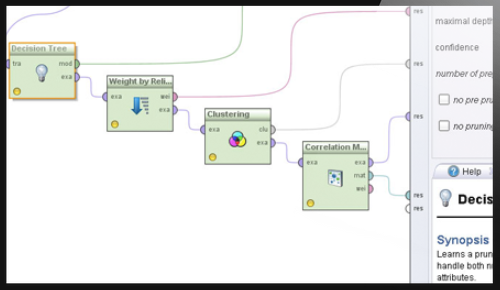 Rapid-I data mining now RapidMiner,
the Redhat of data mining?
German predictive analytics, data mining and text mining company receives $5M in funding and announces a planned move of their headquarters to Boston from Dortmund, Germany. I would liken it to the Redhat of data mining, with a free community edition and paid corporate editions that adds support, more data sources and more capabilities. With over 3 million downloads, 20,000 deployments and 400 paid customers including eBay, Intel, PepsiCo and Kraft you may want to consider RapidMiner for your advanced analytics projects. The 2013 KDNuggets poll showed RapidMiner’s free edition ahead of every other advanced analytics choice including R.
 Finding it hard to make time to keep up with the rapidly changing world of data, data warehousing, analytics, data science, business intelligence and visual analytics? We understand! Here’s our curated summary of relevant news that could help with your future data and analytic projects.
  How Big Data Is Changing Science (and Society)
 Whether you are a CIO, data architect, or a data management professional, it is imperative to understand the different approaches, attitudes and needs of the next generation of data warehouse consumers. Traditional data warehouse users include reporting teams, BI teams (who created reports for the rest of the company), statisticians and others. In the past few years, this has been rapidly changing with the new roles of data scientists, the rise of Data Enthusiasts and the burgeoning population of Accidental Analysts. In Part 1 of this series, we focus on successful collaboration between data scientists and data warehouse teams.


 Freakalytics Timeline