Upcoming analytics courses, free webinars and articles
December 2013 newsletter

Thanks for your interest in our newsletter, please forward it to colleagues that may benefit from it. Please join us for our upcoming webinar next Monday on common analytic issues and mistakes in Tableau 8.
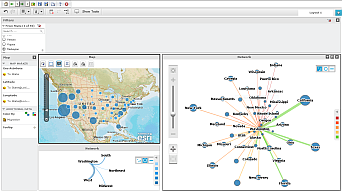
Eileen and I are excited to share our new courses on Tableau, Microstrategy Analytics Desktop (a free alternative for visual analytics and dashboards), SAS programming and data exploration and visualization are all available for on-site instruction.

We are booking engagements with clients for on-site training and strategic consulting projects throughout Q1 and into Q2 of 2014, please let us know if we can help you in 2014!

Data Management and Visual Analytics with Tableau (2 days)
January 28th-29th, 2014—Chicago, Illinois
Everyone can benefit from learning a reliable, flexible and repeatable method to analyze real-world data. Combine this with a solid grounding in the flow and core features of Tableau to achieve great returns with this course. In just two days, you will complete multiple real-world case studies with Tableau paired with supporting data management capabilities of Microsoft Excel and Microsoft Access.

Data Management and Visual Analytics with Microstrategy Analytics Desktop (2 days)
Microstrategy Analytics Desktop is an exciting new offering of Microstrategy, an established leader in business intelligence. Available as a free product for both personal and professional use, Freakalytics considers this new product a good alternative to other leading products in visual analytics and analytic dashboards. It is capable of working with local data sources such as Excel, text files and Access databases in addition to remote, big data sources such as SQL Server, Oracle, MySQL and Hadoop.
Read more

Eight common analytic issues and mistakes in Tableau 8

Understand them, avoid them and correct them December 23rd, 2013 — 11 AM Central, Noon Eastern, 9 AM Pacific, 5 PM London Click here to register Synopsis In this webinar, Stephen reviews common shortcomings and misunderstandings that can prevent effective use of Tableau. These issues can result in misleading or just plain wrong answers being … Read more

Free Tableau 8 e-book at the TCC Alteryx Pavilion!

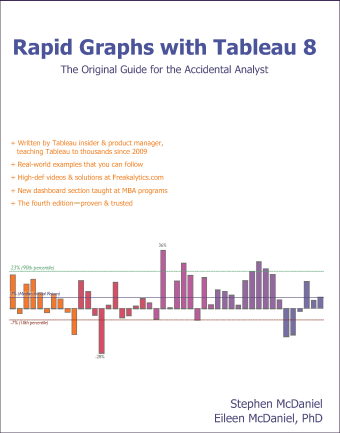
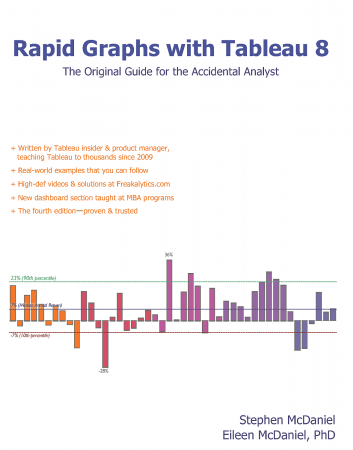
RGTS 8 Book Cover Front 1500Visit the Alteryx Pavilion at Tableau Customer Conference 2013 in Washington, DC next week to learn more about the value of Strategy Analytics and Alteryx for Visual Analytics.  Notably, attendees can pick up a complimentary USB key with Visual Analytics Best Practices including work by Freakalytics and the key even includes a preview of Rapid Graphs with Tableau 8 and a coupon code for a free copy of the e-book! Note that you must redeem your code by September 18th, 2013.

This is the original guide to Tableau for The Accidental Analyst®.  Now in its fourth edition, this is the best-selling book on Tableau, trusted by thousands including many Tableau employees who learned Tableau from it- both before and after joining the company!  Back in 2009, Elissa Fink (CMO at Tableau) wrote about Rapid Graph with Tableau Software 5, “A must read for anyone interested in Tableau. Clear explanations, practical advice and beautiful examples!”  Just a few months ago, the Marketing team at Tableau ordered bulk copies of Rapid Graphs for their new customer acquisition program, reiterating their excitement over the four editions of this book!

Read more

Free Access to Rapid Graphs with Tableau 8–Chapter 5

Rapid Graphs with Tableau 8 The Original Guide for the Accidental Analyst We are pleased to provide free access to our book for all site members. It is also available as a printed book on Amazon. The home page for this release is here. Read Chapter 5 (pages 79-96)      Advanced view types in Tableau-79           Scatter … Read more

Free Access to Rapid Graphs with Tableau 8–Chapter 4

Rapid Graphs with Tableau 8 The Original Guide for the Accidental Analyst We are pleased to provide free access to our book for all site members. It is also available as a printed book on Amazon. The home page for this release is here. Read Chapter 4 (pages 59-78)      Core view types in Tableau-59           Tables—an … Read more

Free Webinar—Analyzing Your Data With Excel:
Simple Steps for Actionable Results

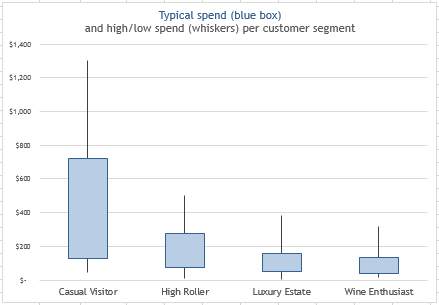
Webinar_Freakalytics_Excel_Analytics_2013_small_spend
Recorded August 22nd, 2013

Do what you can with what you have where you are.
—THEODORE ROOSEVELT
Cowboy, soldier, historian and
26th President of the U.S.

Synopsis
Answer everyday business questions like an analyst with Microsoft Excel. This webinar is based on a selected set of techniques from The 7C’s of Data Analysis, as covered in our book, The Accidental Analyst: Show Your Data Who’s Boss. An abbreviated case study will be used to demonstrate common techniques that can start you on the course to analyzing data with Microsoft Excel 2007, 2010 or 2013.

This presentation is approximately 1 hour and 15 minutes in length.

Read more

Free Webinar—Quick & dirty analysis with Tableau
in 13 lucky steps!

6_Manual_Rearrange_Items_Freakalytics_1_Tableau
July 31st, 2013, Noon Pacific, 3 PM Eastern, 8 PM London
 
 
So much data, so little time!
–Stephen McDaniel
Co-founder of Freakalytics


Synopsis
Let’s face it: in the daily world of work, you often are asked to provide an answer to a new problem in less than a day. Of course, your boss tends to forget about the other three project deadlines you are currently facing, so you really have only 10 or 20 minutes to squeeze in a quick and dirty analysis.

If this sounds familiar to you, this webinar will walk you through the thirteen flexible steps that can take you from being clueless to looking smart with Tableau in just a few minutes. Hopefully you’ll be able to obtain enough information to come up with ideas for an e-mail update or talking points for the unexpected meeting that is looming large over your day, showing your boss and colleagues that you can deliver great results in time to be useful.

So, if you’re already a user of Tableau, this webinar will guide you in the critical path of many analyses in Tableau. If you are totally new to Tableau, you can see the possibilities of what you can accomplish in a short amount of time, once you get started and practice these techniques.
 
 
A preview of the first few steps

1 What question will you examine?

1_PostIts_Flickr_Sources_CC_License


Okay, in reality this step might take hours or even days! But let’s assume you have your question, and if it is complex, break it down into several, simpler questions.

2 Grab the closest, readily available dataset

Read more

Free Webinar—Business analytics and more
with SAS Enterprise Guide

 
Recorded on July 10th, 2013
 
 
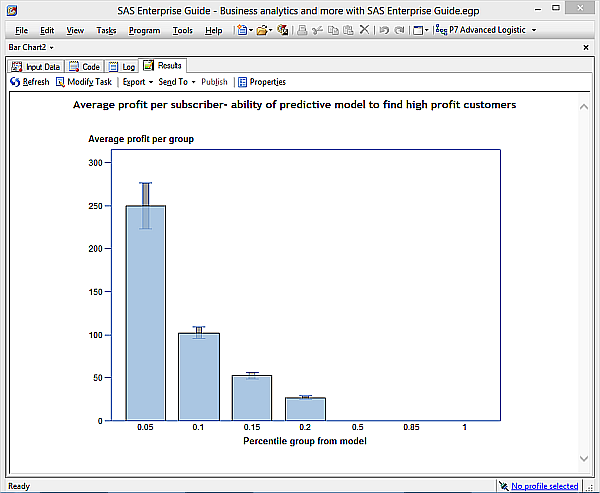
Business_analytics_SAS_Enterprise_Guide_predictive_model_600
 
 
True genius resides in the capacity for evaluation of
uncertain, hazardous, and conflicting information.

–WINSTON CHURCHILL
Prime Minister of England during WWII


Synopsis
In this webinar, Stephen will analyze multiple real-world case studies using SAS Enterprise Guide by following the 7 C’s of Data Analysis. He will collect data from a range of sources, explore the data for common problems, apply quick data fixes, demonstrate best practices of visual analytics and use powerful predictive models that go beyond the limits of standard analysis techniques.
Click here for the full post and to register below

Read more

Rapid Graphs with Tableau 8—Chapter 1 & Table of Contents

The 8 version of this book is published in grayscale in order to meet popular demand for a lower list price versus earlier versions (5, 6 and 7) of this book series.

Rapid_Graphs_Tableau_8_Freakalytics_Copyright_346_433+ Written by Tableau insider
   & product manager, teaching
   Tableau to thousands since 2009

+ Real-world examples that you
   can follow include tips
   and tricks to save you time

+ High-def videos & solutions

+ The fourth edition—proven & trusted

+ Buy it on Amazon


Read more