Estimating future success rates from initial experience
surveys and observation (tutorial)

A wide range of common business questions are often decided incorrectly because decision-makers overlook, forget or neglect the application of a simple concept from statistics. In this tutorial we will walk you through several examples to avoid this potentially costly mistake. Examples where this technique can help include:

Is my ad worth the price?
Conversion (CTR): how many customers converted to a paying customer after clicking on an Google ad and visiting a special offer web page? Based on the revenue generated is the ad price too high?

How many of my customers have children?
Estimating customer demographics: based on a one day survey in every store, what percent of our entire customer base have children?

Who will win the election?
Survey results: what percent of likely voters will vote for Obama based on the responses from a 1,000 people in a poll?

Bringing down the house?
Winning a bet: if my friend flips a coin 10 times and it landed on heads 9 times, is this a “fair” coin?

All of these questions and many others can be answered with the technique explained and demonstrated in this article.


Which states have the most Miss America winners?

Here is a fun example about the Miss America pageant, it appeared on the Ask.com home page.

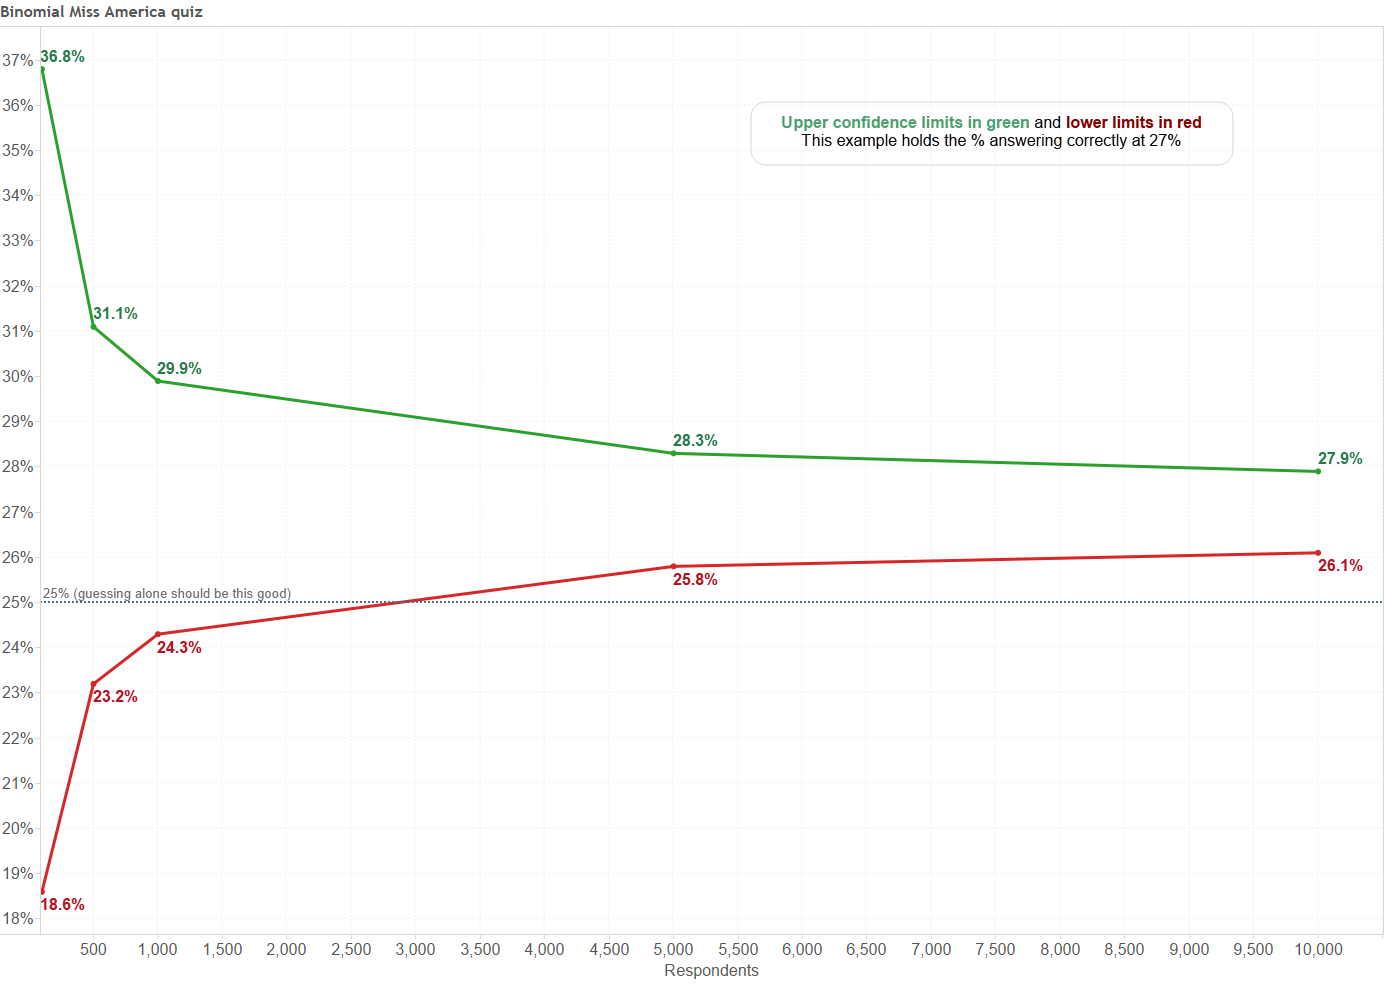
Notice that 27% of Ask.com users picked the correct state for the most Miss America winners, is that good? Well, we should ask how you would perform if you had no information and simply guessed at the answer. With four choices and only one correct answer, you have a 1 in 4 chance (that’s 1/4 = 25%) of guessing the answer even if you have no clue.

So, is 27% actually better than all of these people just guessing@f4 The answer is “it depends” on a missing piece of information- how many people answered this question. If 100 people answered it and 27 answered correctly, there is a good chance that they are all simply guessing. However, if 10,000 answered this question and 2,700 answered it correctly, there is a good chance that some of them answered better than just guessing.


The classic illustration of success- flip a coin

You may be puzzled at this point. Don’t fear. Let me move to a simpler example, flipping a coin. Believe it or not, it is very similar to the multiple choice question above, with the main difference being the chance of “success”- guessing heads or tails correctly, which is 1 in 2 or 50%. So, if I flip it once and you are right, then 100% of flips were guessed correctly. However, this one flip being guessed correctly wouldn’t lead me to believe that you had the ability to see the future (or that the coin is an unfair coin that is always heads). How many flips guessed correctly would it take@f5 Like I have seen followed in many business situations, what does your intuition or gut say@f6

Five out of five correct@f7
Twelve out of fourteen@f8
80 out of 100@f9

Here’s the good news, there is a simple
Read more

Show growth over time but hide the baseline in Tableau

A client asked,

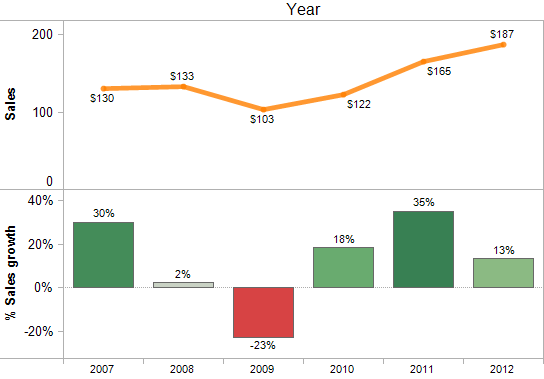
What I want to show is a YoY (year over year) or WoW (week over week) comparison – however the first data point is always missing – even when the underlying data are available.

For example:
The full set of data shows a null value for 2006 – just because there is no data available to compute a comparison.
Now I want to move the date filter to start @ 2007 – and now 2007 has a null value even though we have data available to compute that metric.
” What’s the issue and how can I display only years

Read more

Relative date filters in Tableau dashboards

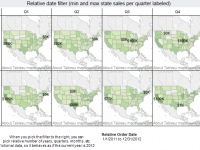
relative-date-filterUsing relative date filters in Tableau dashboards are a great way to keep your dashboard up-to-date with minimal effort. They also provide the consumer with great control if you display the relative date filter as a quick filter on the dashboard, since they enable extensive customization to the time period displayed.
 
In this dashboard, the current and prior year are displayed. By interacting with the quick filter, you could easily adjust this to one year, two quarters or even two months of data. Give it a try.

Read more

Data Driven Conference 2012

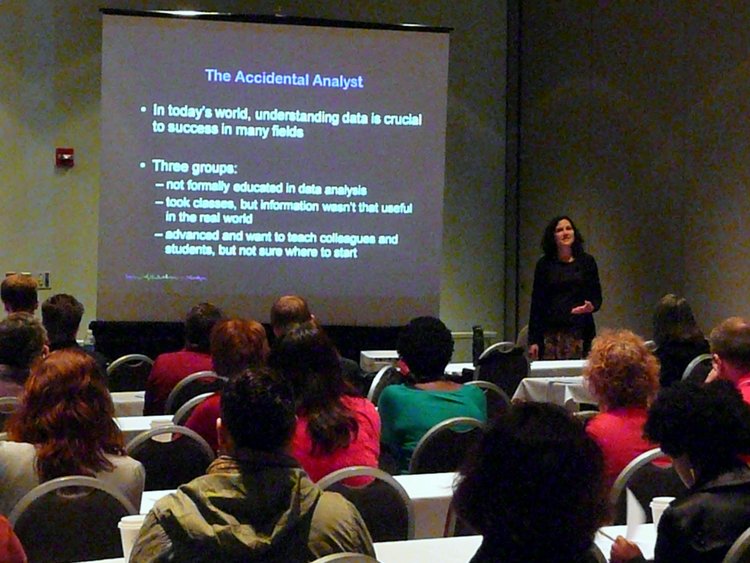
We are having a great time at the Data Driven Conference in Columbus! Our first session was standing room only and we are presenting the same talk a second time at 1:30 in E161.

Interesting questions include “how do you become better at asking the right questions that lead to better analysis” and “how do you communicate with IT to get better data”?

To buy a copy of The Accidental Analyst, please visit www.AccidentalAnalyst.com.

Here is our infographic that we created

Read more

Tableau ranking and displaying specific ranked values

Here’s a general solution for Tableau. It required a view with the level of detail displaying the area of interest, some table calc’s and parameters. I think the better general case solution wold use RANK and PERCENTILES from the database. However, with local data sources, this option isn’t possible! This link is a Zip file … Read more

Book Excerpt: Tableau 7 Quick Table Calculations and Custom Table Calculations

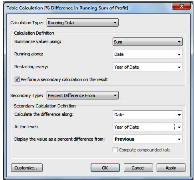
This is a free preview from Rapid Graphs with Tableau Software 7, available in print and Kindle on Amazon and on the Nook at Barnes and Noble. Due to width constraints on this blog, you may notice some loss in resolution compared with the purchased book, which has approximately 2.5 times better resolution.


Read more

Freakalytics newsletter, August 2012

Thank you for your interest in our newsletter. Please share it with your colleagues that can benefit from it. We are happy to share some great news, “The Accidental Analyst” is now available on Amazon in the US and Europe! We will be offering 90 minute book workshops around the country and a one-day course … Read more

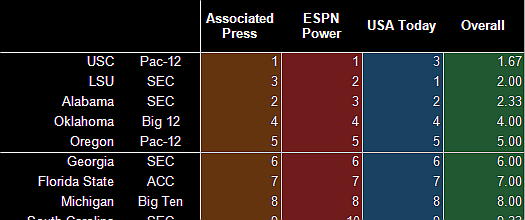
2012 NCAA football rankings–ranks per poll & overall ranking

Teams inlcuded in this week:
USC, LSU, Alabama, Oklahoma, Oregon, Georgia, Florida State, Michigan, South Carolina, Arkansas, West Virginia, Michigan State, Wisconsin, Clemson, Texas, Ohio State, Stanford, Nebraska, TCU, Virginia Tech, Oklahoma State, Kansas State, Florida, Boise State, Notre Dame, Louisville, Washington, Auburn, Georgia Tech, North Carolina, Utah, NC State, Baylor, South Florida, Texas A&M, Cincinnati, Brigham Young, Tennessee, Mississippi State, Virginia, Louisiana Tech, UCF, Houston, Rutgers, Southern Miss, Missouri, Florida Intl, Northern Illinois, Texas Tech

Conferences included in this week:
SEC, Big 12, ACC, Big Ten, Pac-12, Big East, USA, Ind, Mid-Amer, Mntn Wst, Sun, WAC


Read more

2012 NCAA football rankings–top 25 teams per conference

Teams inlcuded in this week:
USC, LSU, Alabama, Oklahoma, Oregon, Georgia, Florida State, Michigan, South Carolina, Arkansas, West Virginia, Michigan State, Wisconsin, Clemson, Texas, Ohio State, Stanford, Nebraska, TCU, Virginia Tech, Oklahoma State, Kansas State, Florida, Boise State, Notre Dame, Louisville, Washington, Auburn, Georgia Tech, North Carolina, Utah, NC State, Baylor, South Florida, Texas A&M, Cincinnati, Brigham Young, Tennessee, Mississippi State, Virginia, Louisiana Tech, UCF, Houston, Rutgers, Southern Miss, Missouri, Florida Intl, Northern Illinois, Texas Tech

Conferences included in this week:
SEC, Big 12, ACC, Big Ten, Pac-12, Big East, USA, Ind, Mid-Amer, Mntn Wst, Sun, WAC


Read more

Webcast: “Big Data” on your laptop, fast, informative and at your command

NOTE: This fun review of “big data” was inspired by a recent presentation I gave on behalf of Tableau Software at the Big Data Conference in Chicago. You can find the 1st part of this 3 part webcast here, “Performance to Cost Index & my personal history with “Big Data” and Part 2 here, “Big Data” in US History, Exploring the 1790 US Census. This part of the big data series is free, just subscribe or sign in below.

In this presentation, I share an example of working with big data stored on my laptop and the entire analysis happens without any type of connection to remote servers or databases. My analysis uses two tables of interest, the first has 216 million records, over ten years of airline ticket pricing in the US while the second table has 72 million records of US airlines performance data extracted from Hadoop. In the demonstration, which uses currently available technologies, we will quickly explore and analyze this data for interesting trends and patterns.

Read more