 A wide range of common business questions are often decided incorrectly because decision-makers overlook, forget or neglect the application of a simple concept from statistics. In this tutorial we will walk you through several examples to avoid this potentially costly mistake. Examples where this technique can help include:
Is my ad worth the price?
Conversion (CTR): how many customers converted to a paying customer after clicking on an Google ad and visiting a special offer web page? Based on the revenue generated is the ad price too high?
How many of my customers have children?
Estimating customer demographics: based on a one day survey in every store, what percent of our entire customer base have children?
Who will win the election?
Survey results: what percent of likely voters will vote for Obama based on the responses from a 1,000 people in a poll?
Bringing down the house?
Winning a bet: if my friend flips a coin 10 times and it landed on heads 9 times, is this a “fair” coin?
All of these questions and many others can be answered with the technique explained and demonstrated in this article.
Which states have the most Miss America winners?
Here is a fun example about the Miss America pageant, it appeared on the Ask.com home page.

Notice that 27% of Ask.com users picked the correct state for the most Miss America winners, is that good? Well, we should ask how you would perform if you had no information and simply guessed at the answer. With four choices and only one correct answer, you have a 1 in 4 chance (that’s 1/4 = 25%) of guessing the answer even if you have no clue.
So, is 27% actually better than all of these people just guessing@f4 The answer is “it depends” on a missing piece of information- how many people answered this question. If 100 people answered it and 27 answered correctly, there is a good chance that they are all simply guessing. However, if 10,000 answered this question and 2,700 answered it correctly, there is a good chance that some of them answered better than just guessing.
The classic illustration of success- flip a coin
You may be puzzled at this point. Don’t fear. Let me move to a simpler example, flipping a coin. Believe it or not, it is very similar to the multiple choice question above, with the main difference being the chance of “success”- guessing heads or tails correctly, which is 1 in 2 or 50%. So, if I flip it once and you are right, then 100% of flips were guessed correctly. However, this one flip being guessed correctly wouldn’t lead me to believe that you had the ability to see the future (or that the coin is an unfair coin that is always heads). How many flips guessed correctly would it take@f5 Like I have seen followed in many business situations, what does your intuition or gut say@f6
Five out of five correct@f7
Twelve out of fourteen@f8
80 out of 100@f9

Here’s the good news, there is a simple formula based on the binomial distribution that can estimate the range of the “true” success rate being achieved based on correct answers (people guessing heads or tails correctly) and total attempts (how many times they tried to answer correctly). Unlike your college courses, I don’t want to focus on the math behind this technique, which is based on the binomial distribution, but rather push you to understand the examples in this article and how you can apply statistical thinking to outcomes you see in your work.
Back to Miss America
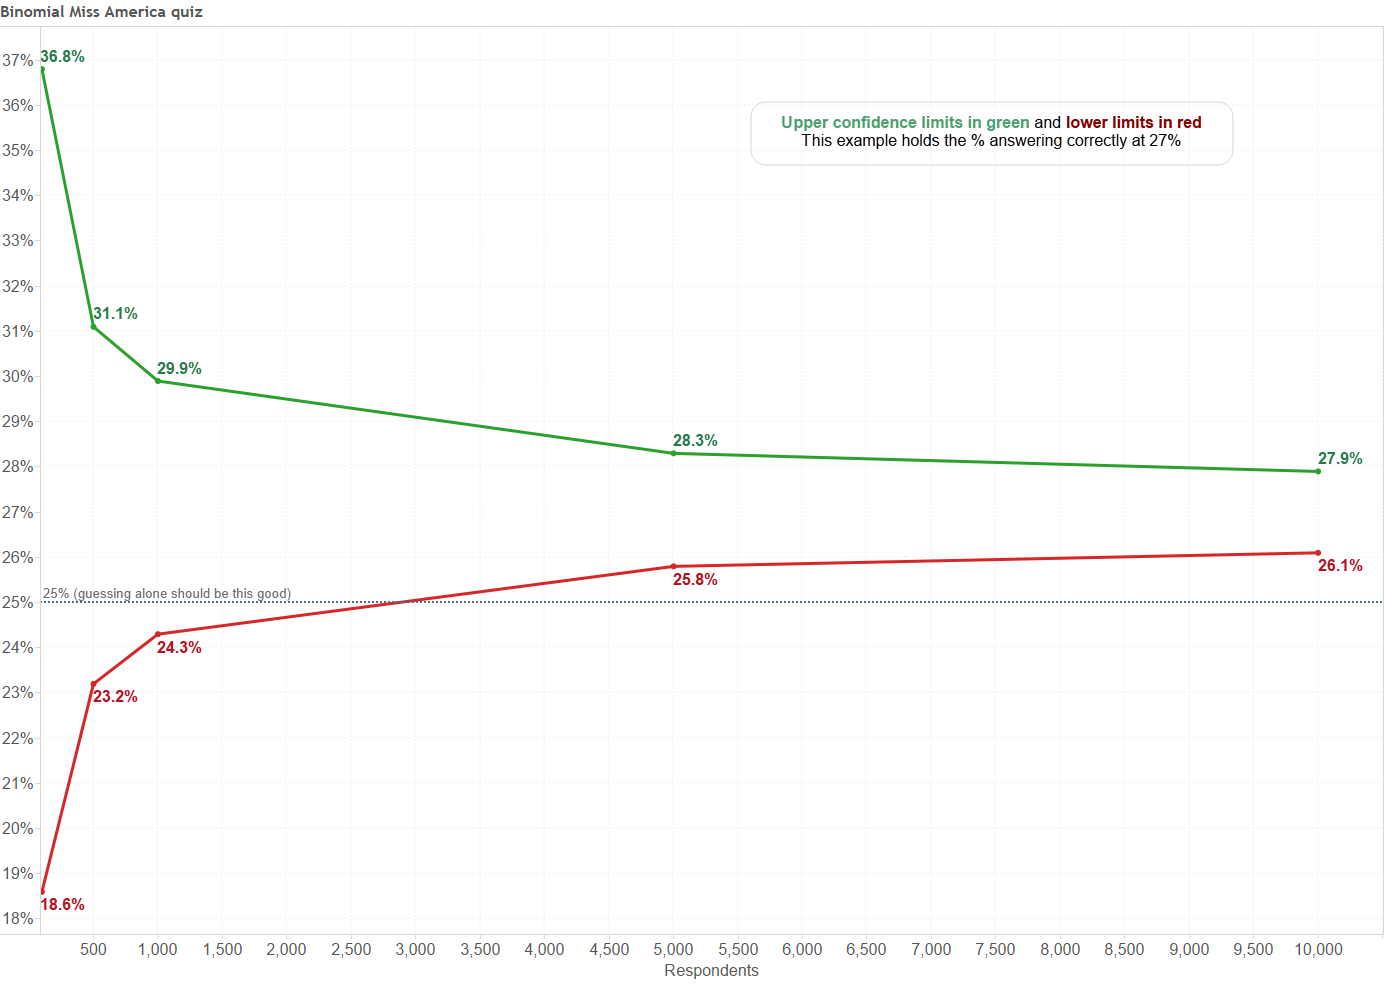
Back to the Miss America example, if 27 people out of 100 answered correctly, the “confidence” interval starts at 18.6% and ends at 36.8%. A common way to explain this interval is to say that 27% ± 8.6% answered correctly (notice that the actual lower end is slightly lower and the actual upper end is slightly higher, I averaged the two direction), this way of explaining it is often used in election polls.
In this example, what does this 27% ± 8.6% mean@f10 It can reasonably be interpreted as 25% (everyone guessing) is a reasonable possibility but so is 36.8% (better than guessing) and even as low as 18.6% will get it right (worse than guessing!) However, the midpoint is the best guess and the further from the center is less likely, but still reasonable.
What if we wait for 1,000 people to answer and see that 270 answer correctly, what happens to the confidence interval@f11 It starts at 24.9% and ends at 29.9%, which still means people could just be guessing even though 27% answered correctly! However, if we wait for 10,000 people to answer and still see 27% correct (2,700), then the confidence interval becomes much smaller, 26.1% to 27.9%- then we can reasonably state that they aren’t all guessing (but only a small percent are likely answering correctly, the % above 25%, based on actually knowing the answer!)
Here’s an illustration of the upper and lower confidence interval in this example. Holding that 27% answer correctly, here’s how the confidence intervals become much smaller as more people answer the question.

As you can see, somewhere around 3,000 respondents is required before the confidence limits don’t include guessing (25%).
Do it yourself- calculating the likely range of success based on success to date
How can you calculate this yourself@f12 An excellent question. We have created a simple Excel spreadsheet that you can use for your data, it is available here. Carefully follow the instructions as you will need to enter the details of what you have seen in your data and then use a feature in Excel (twice) that estimates the confidence intervals for your situation.
Watch the video- a conversion rate example
You can also watch this video to see the sample spreadsheet in action with a third, customer ad conversion example.
In this example, 150 people visited our new book web page by clicking on an ad that costs us $1.75 per person. Of the 150 people clicking on that ad, 30 clicked through from our web site to purchase the book on Amazon, yielding revenue from Amazon of $12 per purchase (for illustration purposes). Assuming the same types of people continue to visit this page from this ad, should we continue to pay $1.75 per click@f13
Most people would answer yes! 20% (30/150) buy the book at an average cost per book of $1.75/20% = $8.75. Subtracting the cost from the revenue per book ($12 – $8.75) yields a gross profit of $3.25. But what if 20% isn’t the long-term conversion rate? Watch the video and then try it yourself.
Internet Explorer requires compatibility mode to view the videos at Freakalytics. On newer versions of Internet Explorer, click the IE gear icon in the upper-right for menus, select Compatability View settings. A dialog appears where you should add freakalytics.com to your Websites you’ve added to Compatability View list.
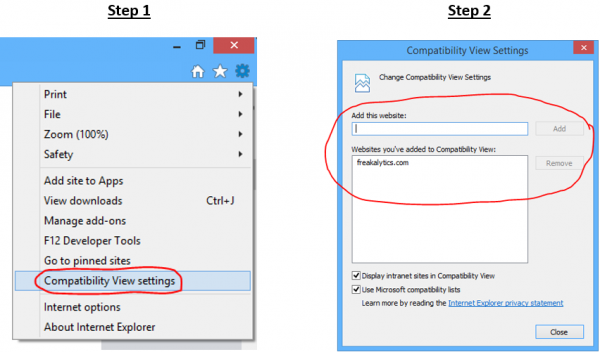
On older versions of IE, click the broken page icon at the far right of the address bar
![]()
Enjoyed this? Please subscribe to our newsletter and share it!
We are a two-person, independent analytics company. Creating great content takes an enormous amount of time! You can support us by sharing this webinar on Twitter, Google + or Facebook—enabling us to continue creating new, unbiased educational content. You can subscribe below and then click one of the buttons above for a well-crafted Tweet, FB or G+ link. Thanks.
Subscribe to our newsletter