January 26th, 2014
Stephen McDaniel
Chief Data Officer Advisor at Freakalytics, LLC
Finding it hard to make time to keep up with the rapidly changing world of data, data warehousing, analytics, data science, business intelligence and visual analytics? We understand! Each week, I read through hundreds of stories in this space and share the five most worthwhile articles with you. Each article includes a summary and link to the full story.
 How Netflix Got Analytics Wrong, Then Right
Two entertaining and informative articles about Netflix illustrate how to be smart about using analytics. In one instance we see where Netflix went wrong, and in another we see Netflix doing the right thing.
Netflix launched a high-profile crowdsourcing project in 2006 to develop a better recommendation engine, offering a $1 million prize to any person or team who could improve Netflix recommendations by a modest 10 percent.
 Signs That Your BI Dashboard Needs a Comeback
Everyone loves a good comeback. Stories about celebrities like Robert Downey Jr. and Britney Spears climbing back to the top after falling so far capture our collective imagination. Movies like Rocky and Cinderella Man – about underdogs making a comeback – inspire us to think we ourselves can rebound from any setback.
Is your business intelligence dashboard the underdog at your organization? Dashboards have been around for decades, with some companies not putting the time and effort into updating them regularly to keep pace with the innovations in BI and the growing expectations of users.
 “Pitch Perfect” And How Analytics Are Transforming Movie Marketing
When Universal released the cult musical film Pitch Perfect in 2012, they did what any self-respecting studio would do: They commissioned marketing reports and forecasted ticket sales for the Anna Kendrick-starring movie. Among them was an analysis by a company called Fizziology which data-mines social media to see how the film would play out with audiences.
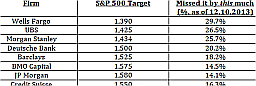 Why Do Forecasters Keep Forecasting?
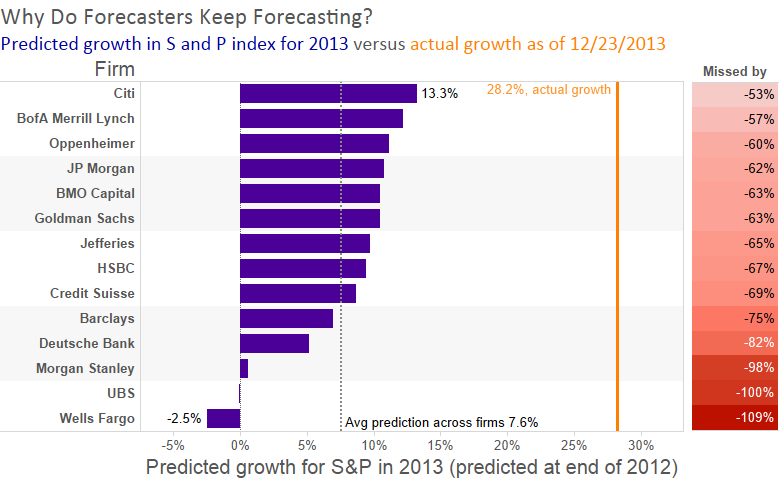
 Eileen and I are excited to share our new courses on Tableau, Microstrategy Analytics Desktop (a free alternative for visual analytics and dashboards), SAS programming and data exploration and visualization are all available for on-site instruction.
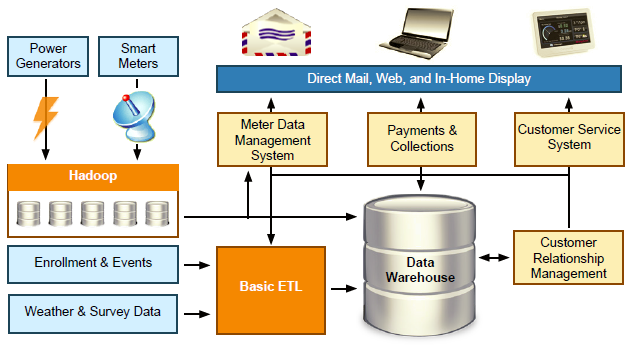
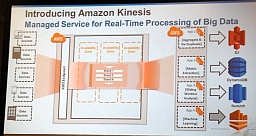 Amazon wades into big data streams with Kinesis
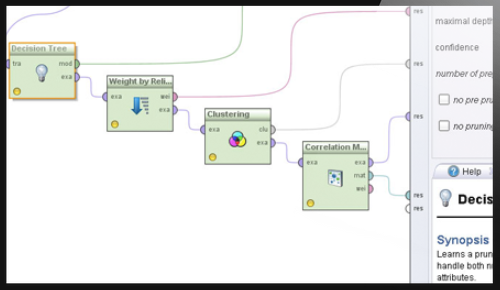 Rapid-I data mining now RapidMiner,
 Finding it hard to make time to keep up with the rapidly changing world of data, data warehousing, analytics, data science, business intelligence and visual analytics? We understand! Here’s our curated summary of relevant news that could help with your future data and analytic projects.
  How Big Data Is Changing Science (and Society)
 Whether you are a CIO, data architect, or a data management professional, it is imperative to understand the different approaches, attitudes and needs of the next generation of data warehouse consumers. Traditional data warehouse users include reporting teams, BI teams (who created reports for the rest of the company), statisticians and others. In the past few years, this has been rapidly changing with the new roles of data scientists, the rise of Data Enthusiasts and the burgeoning population of Accidental Analysts. In Part 1 of this series, we focus on successful collaboration between data scientists and data warehouse teams.