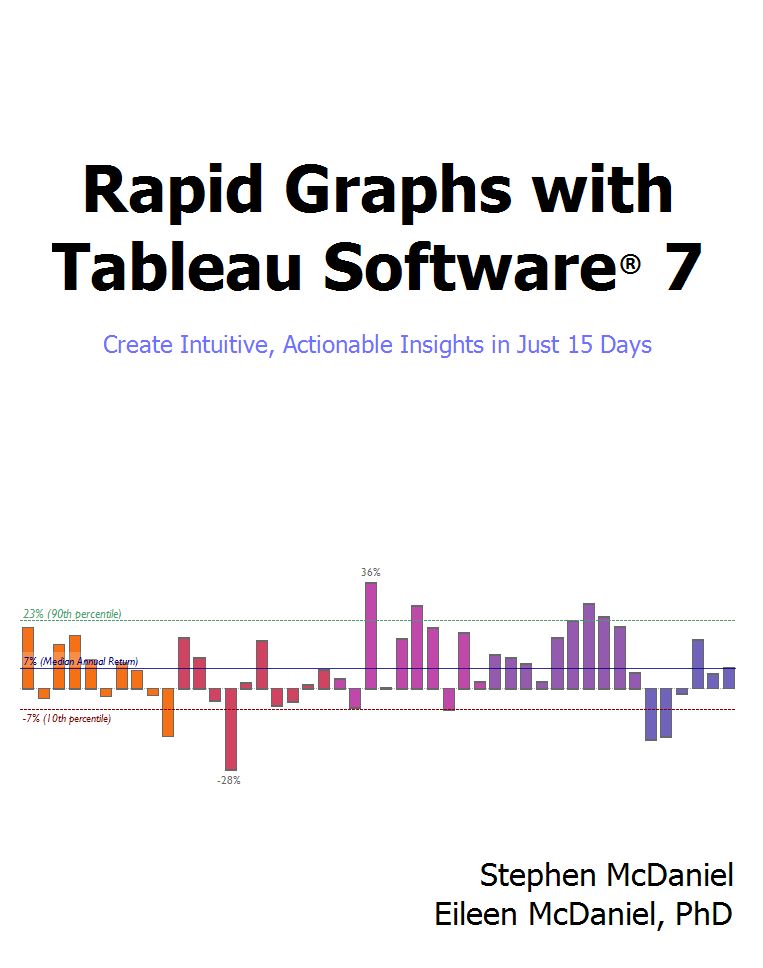
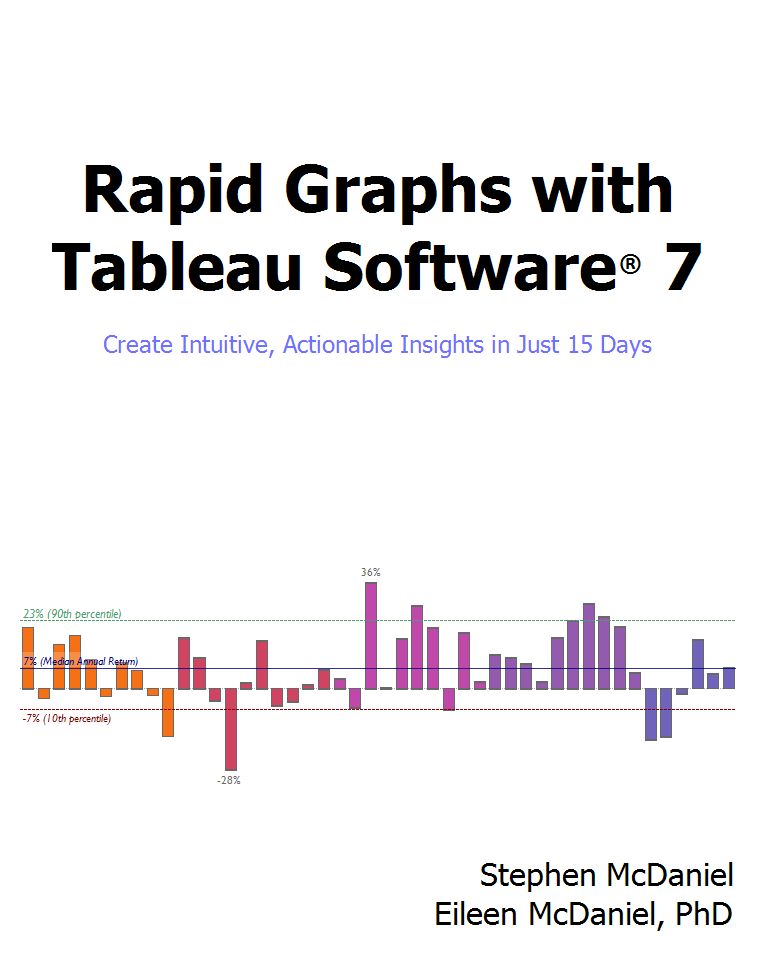
If you are looking for how to buy the book, please follow this link.
 There are three sample datasets used in the Tableau 7 book that are free for anyone to use, but you must be a registered user of our site to access these downloads. Registration connects us with you so we can e-mail you 2-3 times per year with course schedules, book updates and other topics of interest. You may unsubscribe from the e-mail list at anytime by visiting our home page and clicking on the unsubscribe link. Please note that we will never share this registration information with another company.
Month: April 2012
Rapid Graphs with Tableau Software 7 now available on Amazon, Kindle and Nook

Buy the Kindle version at Amazon, just $9.97! (free preview)
Buy Nook book at Barnes & Noble, just $9.97! (free preview)
Buy the print version at Amazon US, UK, Germany,
France or Spain (only in English, regardless of source country)
International shipping alternative to Amazon
Still using Tableau 6? Yes! You can buy the 6 version!
Tired of boring spreadsheets and data overload from confusing graphs? Master the art of rapid graphs with Tableau! Tableau is designed with one goal in mind, to give you the power to quickly explore and understand your data so that you can make informed decisions in a wide variety of real-world situations. After learning Tableau, you will be able to communicate your findings with audience-friendly graphs and tables.
“A picture is worth a thousand words” is a common saying that is more relevant today
Tableau customer profile, Eystein from Norway, Banking & Insurance
Customer
Eystein from Norway
Favorite quote speaking with him
“Make it simple and fast, my IT team was cheering on Tableau after trying it and QlikView. They really hoped we would pick Tableau and I am very happy we did.”
Situation
Eystein recently took over a BI team that wanted to accelerate use of data across every area of the bank and subsidiaries. The bank and subsidiaries are heavy users of SAS Enterprise Guide, SAS Web Report Studio and SAS Enterprise Miner.
They have a variety of data sources and data marts throughout the business. There is also a centralized Enterprise Data Warehouse (EDW) effort that is making headway, but has a long list of items ahead of them. In the meantime, SAS users are rapidly creating new data pulls that Eystein would like to use in Tableau. He realizes that the EDW team will never be able to have all the data that is needed by the business, so SAS is a good platform to prep the data for widespread analysis in Tableau.
Status
They recently evaluated fast analytic tools from
Newspapers of Spain dashboard for Tableau Customer Conference 2012
In honor of our beautiful host country, Spain, we have created a dashboard of the major newspapers available in Spain by city, circulation and whether it is in Catalan (the language of this area in Spain.) This dashboard was created in just 30 minutes with Tableau and a glass of Spanish wine at our side! … Read more
