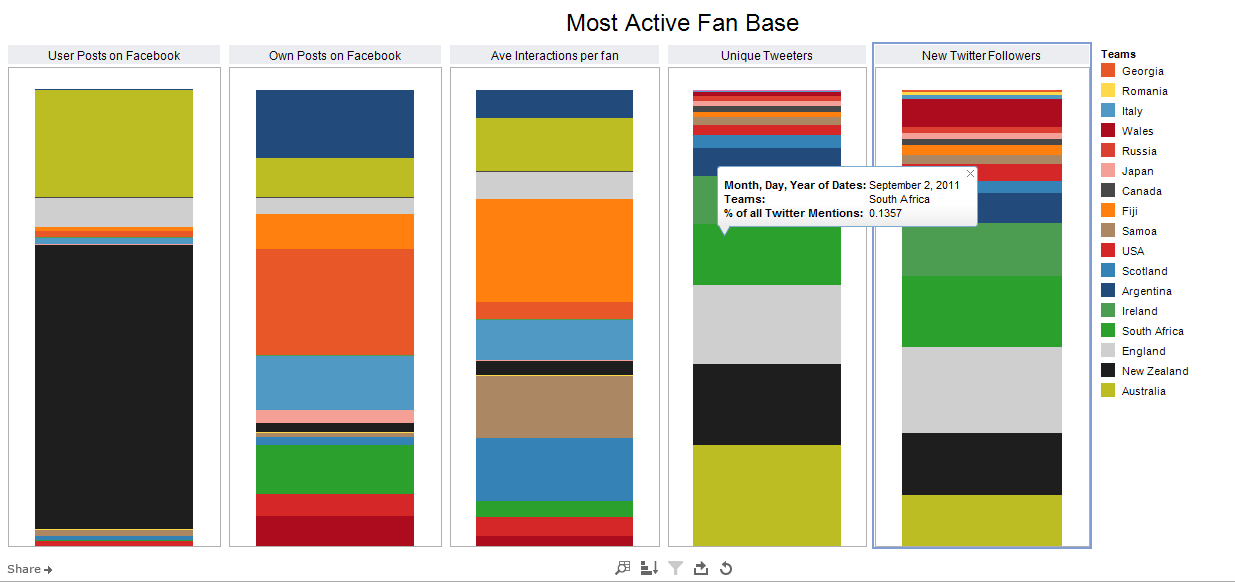
While working hard on a busy weekend, I decided to take a “break” from our upcoming book and client work to spend 30 minutes to help and surprise a newer user of Tableau- social media expert Justin Flitter of New Zealand. He is new to Tableau Public and had started off with a look at some social media metrics by country. Here is a snapshot of his initial work:

After reviewing his initial workbook, I decided to have some fun and see if another approach might be valuable. Here’s the fruits of my labor, just 30 minutes in Tableau. Thanks Justin for sharing some interesting data!
Freakalytics is the exclusive source of the original
Complete Tableau Training (4 days) and our new course,
Data Management and Visual Analytics with Tableau (2-days).
For a detailed review of Tableau features, pricing and capabilities, visit PowerTrip Analytics.
For the Tableau Online pricing calculator, click here.
Securely share R shiny apps
Develop R shiny apps
All on one dedicated, secure and powerful platform.