
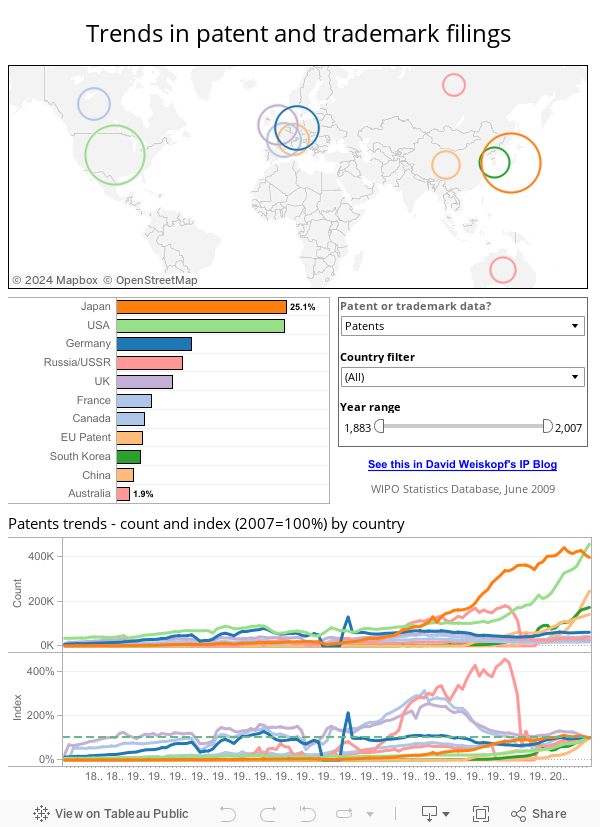
I was fascinated with a dashboard on the growth of patents and trademarks by Ross Perez and David Weiskopf, both of Tableau Software. It displays 124 years of patent and trademark data from a variety of countries.
You can see the original posts on Tableau’s blog and on David’s personal blog. I chose to enhance this further using the very limited space in David’s blog, 600 x 800 pixels.
I made the following enhancements to enable additional insights:
1) Removed the color legend and replaced it with a bar chart showing the ranking of the countries. The top and bottom countries automatically display the percent of total, showing the range of values for the current dashboard selections.
2) Added a filter by country to enable viewing details in smaller countries
3) Added a filter by year, to enable easy reduction of the range of data included in the views.
4) Removed percent of whole view in the bottom half of the trend plot and replaced it with an index of count, using a baseline year of 2007 which indexes to 100% for each country. This allows a consistent termination point across all countries.
Freakalytics is the exclusive source of the original
Complete Tableau Training (4 days) and our new course,
Data Management and Visual Analytics with Tableau (2-days).
For a detailed review of Tableau features, pricing and capabilities, visit PowerTrip Analytics.
For the Tableau Online pricing calculator, click here.
Securely share R shiny apps
Develop R shiny apps
All on one dedicated, secure and powerful platform.