 As TDWI and vendors catch on to the success of “Agile BI” being created with products like Tableau, I find the need to reply to the idea that the same old technology will work in this new world. This article from TDWI energized me to write a response to this frequently cited idea. In case you aren’t familiar with the acronmym “BI”, it simply means business intelligence, typically referring to traditional tools like Cognos, Business Objects, Excel, Microstrategy, SAS and many other products.
What is Agile BI?
“Agile BI” is new-found jargon that describes what Tableau has always been about- answering relevant, ongoing line of business questions today, rather than someday. It is the polar opposite of how most BI teams have been oriented and managed. In fact, this approach requires a great deal of trust in empowering the consumers of BI as the primary creators of analyses, not the BI team!
In short, it is an approach that assumes the technical team creates an environment that will enable rapid analysis and research of the corporate data available to the business. It is an approach that assumes that many of the questions that arise in the business should be answered in the next few days, not in the next few weeks or months. Tableau fits incredibly well into this space because it was designed around the typical workflow of people’s questions, using simple visuals to illustrate the state of the business.
Why Agile BI?
The good news is that Agile BI is the answer to the most frequent complaint of many executives – that traditional BI is very slow in adapting to rapidly changing business questions and business structures.
Where the TDWI article has it wrong…
With these important clarifications, I would disagree strongly with the later comments in this TDWI article, “Agile BI is not a replacement for the existing BI infrastructures that most organizations have in place today” and “one doesn’t buy agile — one does (one in effect becomes) agile”.
Yes, it’s true that you can’t buy the attitude and orientation described above, taking on the role of an enabling team rather than being the owner of the analysis process. However, I would argue that buying and deploying analytic tools that have been designed with this empowerment in mind are desperately needed in many companies.
Why you need better tools, designed for agility…
The failure of many BI efforts actually stems from that fact that most BI tools were not designed around the analytical thought-process, but rather around the traditional BI “feature-wars” paradigm. This is precisely why I chose to write the 1st book on Tableau. My experience with Tableau at Netflix and other companies clearly showed me how much simpler the analytic process could be, empowering the consumers of data to understand very complex questions.
Of even greater importance, I realized that analytics created by subject matter experts embedded in the line of business were often of superior quality and value to the organization, versus those created by technical or analytic experts. The use of tools like Tableau radically shifts the purpose of having analytic experts in an organization- from that of the “oracle” to one of a personal trainer and mentor.
Conclusion
In closing, Agile BI is here; your users will discover it over the next few years. As a BI team, to be on the leading edge, you must change your plans and mindset to one of creating a data and technology infrastructure that actually empowers users to answer ongoing questions. You must be prepared to lose control of the later steps of the analytics process and instead focus on training and assisting data analysts throughout the company to easily answer questions.
Agile BI compels a BI team to consider abandoning the failing paradigm of central control to one of central support and empowerment of the business. BI is changing for good; I hope you will join us in leading the way to empower the business and enjoy a whole new era of analytic enlightenment.
An illustration
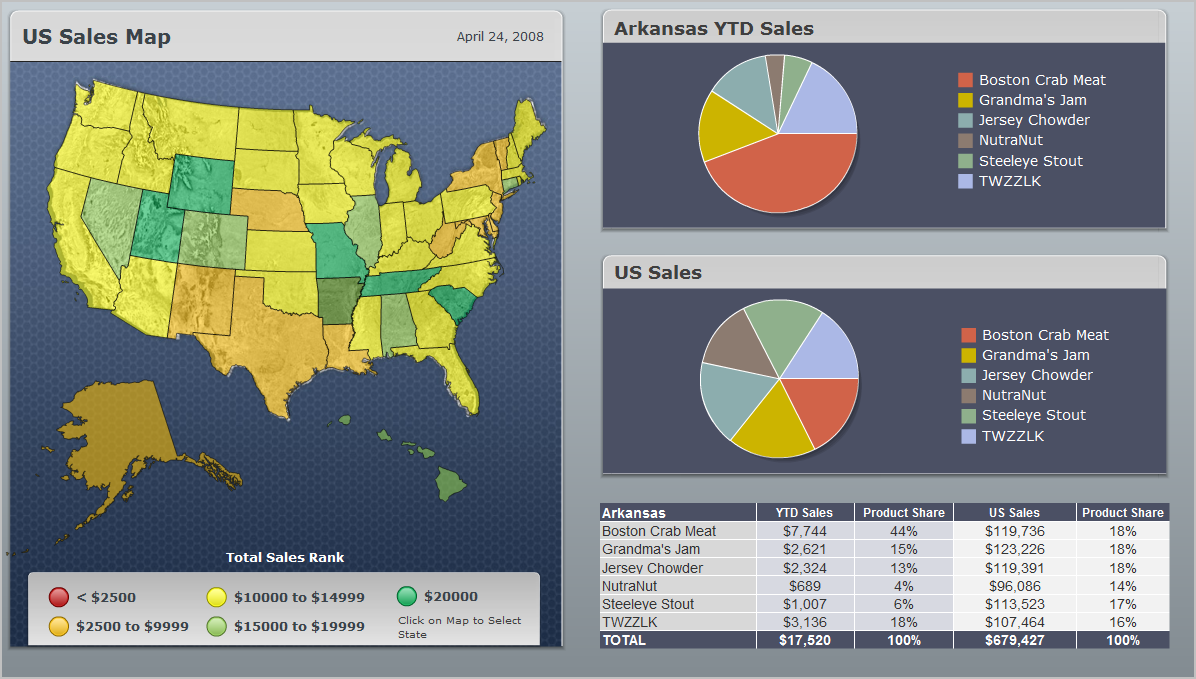
To illustrate, I have attached a screenshot of a recent dashboard demo by XCelsius, part of the Business Objects product line. After examining this dashboard, I created a similar set of data in Excel for use with Tableau. After examining their dashboard for available insights, it was very obvious that their dashboard had missed the mark.
I spent about an hour in Tableau creating a dashboard in response. I would love to know how long it took XCelsius to create their demo- my guess would be several days… Perhaps they might be willing to take me up on my BI challenge?
The intention of the original XCelsius dashboard appears to be demonstrating product mix by state versus typical product mix across the US. As a marketer and sales rep, this is very valuable information about consumer preferences and possible opportunities for future marketing campaigns.
Unfortunately, the XCelsius dashboard makes it fairly difficult to understand these insights. In my dashboard, I created an index of product penetration versus average penetration across the US. I show this in a simple table (sales report) and using a bullet chart. In the bullet chart, the actual state penetration per product (bars) is contrasted with the typical sales penetration (a reference line) for this product across the US. Contrast this approach with the dual pie charts in the XCelsius demo dashboard.
I think this approach exemplifies the difference between Agile BI (easy tools, good data and subject matter insights) versus traditional BI (jam all of the data in display with some cool features!) Truly Agile BI should enlighten the user so they can move forward in the process of understanding the situation and making informed decisions.
Freakalytics is the exclusive source of the original
Complete Tableau Training (4 days) and our new course,
Data Management and Visual Analytics with Tableau (2-days).
For a detailed review of Tableau features, pricing and capabilities, visit PowerTrip Analytics.
For the Tableau Online pricing calculator, click here.
Securely share R shiny apps
Develop R shiny apps
All on one dedicated, secure and powerful platform.
