
Looking for our in-person public and on-site training?
This webinar is relevant for all experience levels of Tableau users. Attendance at this webinar is free, compliments of Freakalytics and their upcoming, in-person Chicago Workshop in late January, Data Management and Visual Analytics with Tableau. Register, compliments of Freakalytics – Collapse it Synopsis Watch it now, compliments of Freakalytics – Collapse it If this sounds familiar to you, this webinar will walk you through the thirteen flexible steps that can take you from being clueless to looking smart with Tableau in just a few minutes. Hopefully you’ll be able to obtain enough information to come up with ideas for an e-mail update or talking points for the unexpected meeting that is looming large over your day, showing your boss and colleagues that you can deliver great results in time to be useful. So, if you’re already a user of Tableau, this webinar will guide you in the critical path of many analyses in Tableau. If you are totally new to Tableau, you can see the possibilities of what you can accomplish in a short amount of time, once you get started and practice these techniques. Watch it now, compliments of Freakalytics – Collapse it –WINSTON CHURCHILL Standard business analytics can be quite powerful, enabling you to see who did what and also where and when it happened. Advanced methods such as predictive analytics and data mining techniques can lead to a more valuable analysis for multiple reasons, by allowing you to: 1. Discover possible causes and even predictions for the future. Watch it now, compliments of Freakalytics – Collapse it In this complimentary webinar, Stephen will walk you through the steps to build one of the advanced dashboards that ships in Tableau 8. Stephen will be using the World Nuclear Power Plants example that he designed while Director of Analytics at Tableau. Stephen was inspired to create this example based on the work of Peter Aldhous at The New Scientist. This webinar is an advanced review of features useful to people already familiar with the basics of dashboard development in Tableau. If you are new to dashboard development in Tableau, you can attend for ideas of what is possible with dashboards in Tableau 8. A sample workbook link is provided for attendees to follow along and experiment with some of the features demonstrated during this webinar. Watch it now, compliments of Freakalytics – Collapse it –JOHN TUKEY Part 2 Topics Watch it now, compliments of Freakalytics – Collapse it –JOHN TUKEY Part 1 Topics Watch it now, compliments of Freakalytics – Collapse it
Looking for our in-person public and on-site training? Enjoyed this? We promise to:
Free webinar—Eight common analytic issues and mistakes in Tableau 8
Watch it on December 23rd, 2013 at Noon Eastern Time
Register, compliments of Freakalytics
+ Read about it
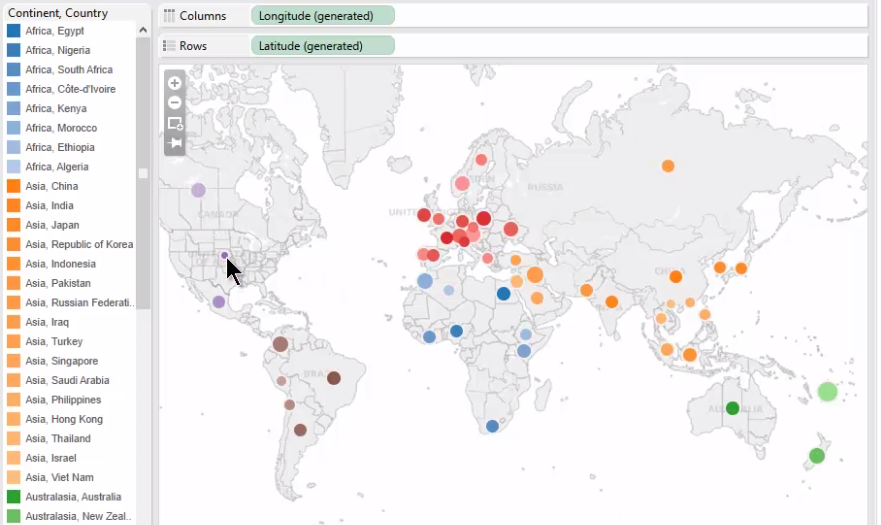
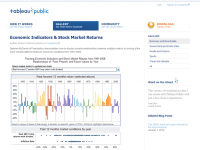 In this webinar, Stephen reviews common shortcomings and misunderstandings that can prevent effective use of Tableau. These issues can result in misleading or just plain wrong answers being presented to your analysis audience, most without any warning messages or signs.
Analyzing Your Data With Excel: Simple Steps for Actionable Results
Recorded August 22nd, 2013
Watch it now, compliments of Freakalytics
+ Read about it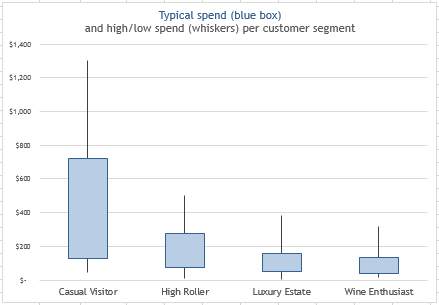
Recorded August 22nd, 2013
Do what you can with what you have where you are.
—THEODORE ROOSEVELT
Cowboy, soldier, historian and
26th President of the U.S.
Answer everyday business questions like an analyst with Microsoft Excel. This webinar is based on a selected set of techniques from The 7C’s of Data Analysis, as covered in our book, The Accidental Analyst: Show Your Data Who’s Boss. An abbreviated case study will be used to demonstrate common techniques that can start you on the course to analyzing data with Microsoft Excel 2007, 2010 or 2013.
Quick & dirty analysis with Tableau in 13 lucky steps!
Recorded July 31st, 2013
Watch it now, compliments of Freakalytics
+ Read about it
So much data, so little time!
–Stephen McDaniel
Co-founder of Freakalytics
Synopsis
Let’s face it: in the daily world of work, you often are asked to provide an answer to a new problem in less than a day. Of course, your boss tends to forget about the other three project deadlines you are currently facing, so you really have only 10 or 20 minutes to squeeze in a quick and dirty analysis.
Business analytics and more with SAS Enterprise Guide
Recorded July 10th, 2013
Watch it now, compliments of Freakalytics
+ Read about it
uncertain, hazardous, and conflicting information.
Prime Minister of England during WWII
Synopsis
In this webinar, Stephen will analyze multiple real-world case studies using SAS Enterprise Guide by following the 7 C’s of Data Analysis. He will collect data from a range of sources, explore the data for common problems, apply quick data fixes, demonstrate best practices of visual analytics and use powerful predictive models that go beyond the limits of standard analysis techniques.
2. Avoid costly mistakes based on natural variability in the business data, a common error among business analysts.
3. Better separate noise in the data from a true signal, guiding you to confident decisions.
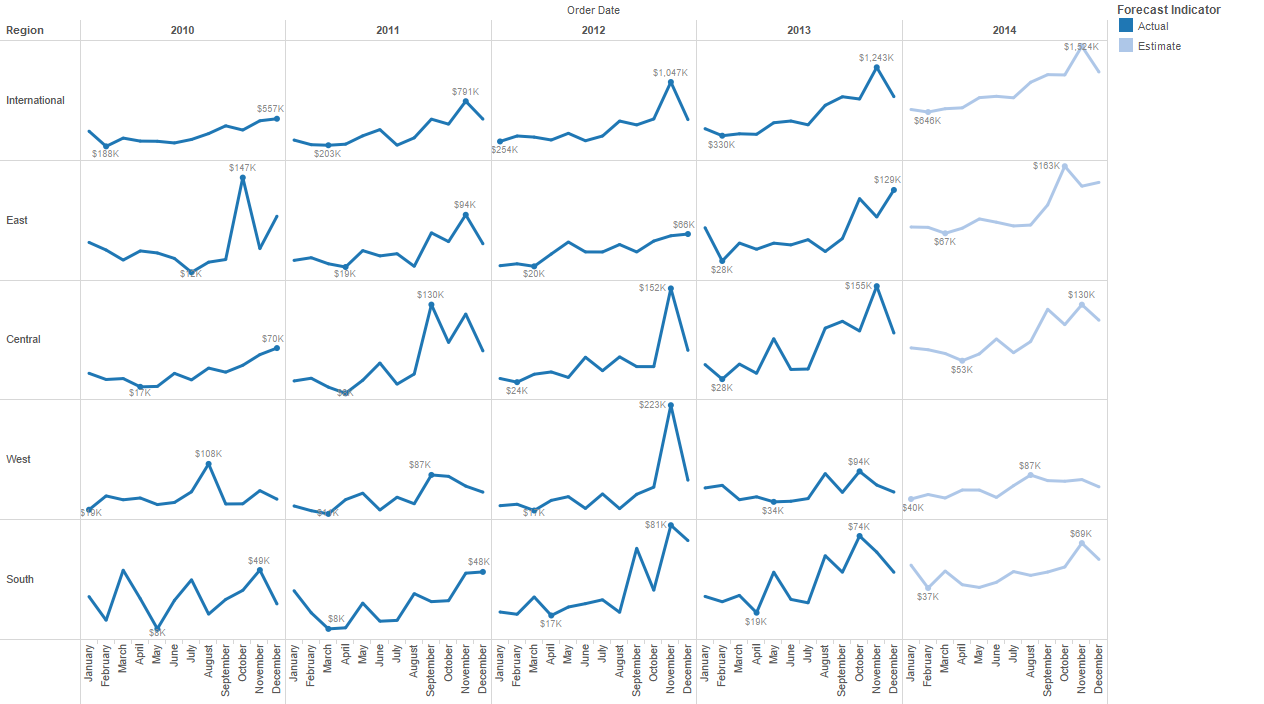
Better Dashboards in Tableau 8
Recorded June 11th, 2013
Watch it now, compliments of Freakalytics
+ Read about it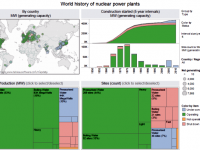 Attend this complimentary webinar for ideas and inspiration to design informative, dynamic and captivating dashboard experiences with Tableau 8.
Better Analytics in Tableau 8, Part 2
Recorded February, 2013
Watch it now, compliments of Freakalytics
+ Read about it
 If you display information the right way,
anybody can be an analyst.
Prominent American statistician
who first used the word “software”
+Treemaps and packed bubble charts
+Automatically selecting the right data for your analysis
+Forecasting for smarter planning
+Google Analytics on the desktop—fast, beautiful and blend it with your data
Better Analytics in Tableau 8, Part 1
Recorded January, 2013
Watch it now, compliments of Freakalytics
+ Read about it
 If you display information the right way,
anybody can be an analyst.
Prominent American statistician
who first used the word “software”
+Multi-item color encoding
+Multi-item data labels
+Creating sets in Tableau 8
+Union, intersection and partial sets; using sets in calculated fields
Subscribe to our newsletter and keep up to date on our latest courses, webinars and articles
– Send exclusive content quarterly,
– Never share your info,
– Offer a simple way to unsubscribe