S&P Composite Stock Market Returns Dashboard

Finance-SnP-stock-market-returns-100-yearsEconomic Indicators and S&P Composite Returns
from 1901-2008
A Dashboard to Explore Past, Present and Future Results

When creating a dashboard, two critical questions to ask include, “what are the right metrics” and “what collection of graphs will optimize exploration and understanding from a complex relationship between multiple metrics”? This example uses historic economic and stock market data to explore these concepts and to provide powerful insights into stock market patterns relative to economic conditions. This interactive dashboard is powered by tableau public, a new service of Tableau Software. One means of interacting with this dashboard is data point brushing, highlight data in a part of the dashboard by single-clicking and dragging
Read more

The Value of a Great Analyst- About $3M per Year!

Read the full presentation here, “Overvalued Software Products and Undervalued Analysts? The Value of a Great Analyst in Business Analytics”

I recently pondered the value of a great analyst to a mid-sized public company (revenues around $1-2 billion.)   Based on my experience at multiple companies, I estimate the productivity, typical project benefits, and costs of an average, good and great analyst. The differences in the return to a company are staggering with great analysts yielding double the ROI of a good analyst and triple the ROI of an average analyst!

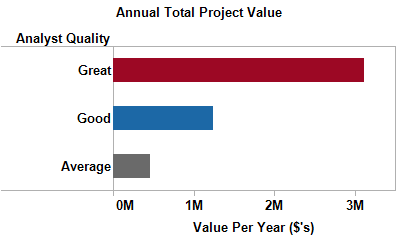
My conservative estimates of analyst project results (annual value to the firm) are $460k for average analysts, $1.2m for good analysts and $3.1m for great analysts!

Analyst_value

There are two primary drivers behind the much higher value produced by great analysts (illustrated in the following graph):

Read more

Maximizing Sustainability by Incorporating Consumer Behavior & Environmental Expert Opinion

Download the full paper by Eileen McDaniel, Ph.D., “A Practical Framework for Green Policy Decision-Makers: Maximizing Sustainability by Incorporating Consumer Behavior and Environmental Expert Opinion” (PDF.)

Executive Summary
Which “green” activities are consumers performing in their everyday lives?   Activities that-
–       Save them money?
–       Are easy to do?
–       Are the most beneficial to the environment?
–       Some combination of the three?

By combining insights from a recent survey of consumer behavior with expert opinion on green activities I found that:
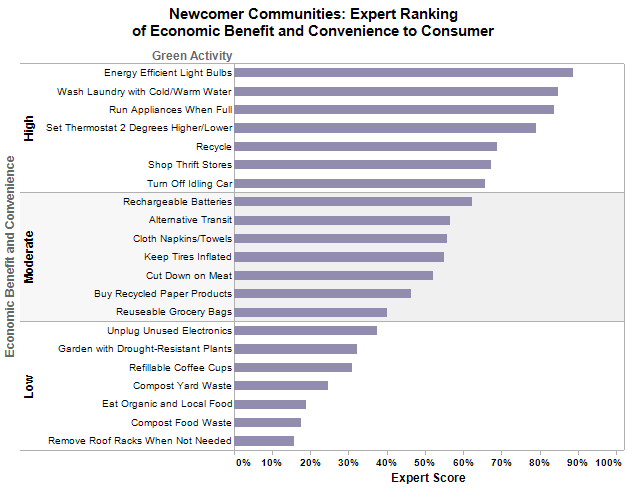
–       Activities that experts rank as the most beneficial for the environment are not always performed frequently by consumers.
–       Economic benefit to the consumer is a stronger predictor of frequently-performed activities than environmental benefit.
–       However, convenience to the consumer is the best predictor of green behavior!

Decision-makers for sustainability programs can tailor this method to their particular location by:
–       Compiling a list of green activities specific to their region.
–       Surveying local consumers and experts.
–       Altering which dimensions are included in assessing the importance of various green activities.

“Newcomer” communities can maximize the impact of launching their green programs by:
–       Prioritizing activities that are convenient and economical for the consumer.
–       Motivating consumers with educational programs and incentives.
–       Waiting until the environmental program has gotten off the ground before encouraging activities that are low in convenience and economic benefit- unless they can be financially subsidized.

Newcomer Communities

Read more

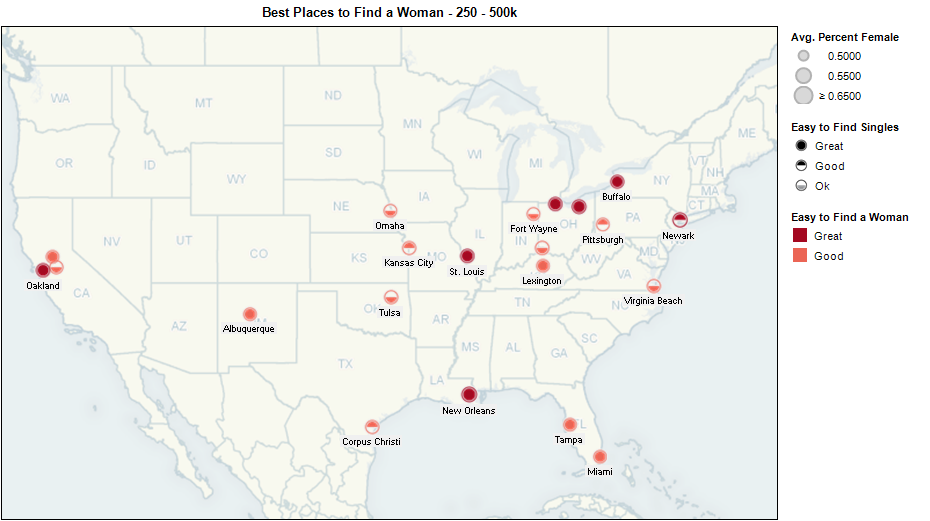
Match.com and the City You Live In- Equally Important to Finding a Date?

After reading several articles, I decided to add my help for wayward singles seeking the right city to call home.   Following in the footsteps of work in the New York Times and Sperling’s BestPlaces, I seek to create a visually intuitive presentation about the “best” place to be single.   In particular, I seek to find the best cities based on concentration of singles and offer insights about cities with better odds for women and men- with some surprising results!

I hope this is a fun topic for everyone and a useful reference for some!

The presentation with maps: click here for presentation.

Best Medium-Sized Cities for Men

Read more

Visual Analytics Best Practices—avoid flash, keep it simple!

Why don’t you just show me the numbers?

  • Poor presentation of data can make informative interpretation difficult or even impossible.
  • We spend years diagramming sentences & solving equations but have minimal exposure to telling stories with data!
  • The ability to explore, understand and utilize real-world data is a rare skill that can dramatically improve your organization and career.

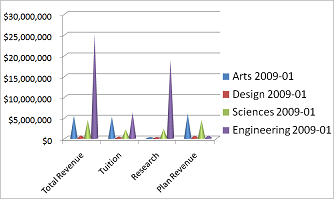
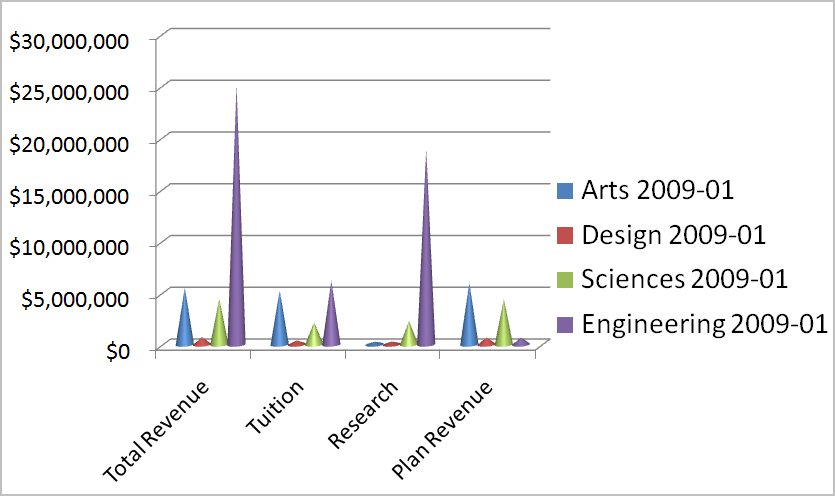
Sample revenue data from a university

College Quarter Total Revenue Tuition Research Plan Revenue
Arts 2009-01 $5,510,268 $5,230,198 $280,070 $6,000,000
Design 2009-01 $703,770 $408,762 $295,008 $680,000
Engineering 2009-01 $25,139,083 $6,201,932 $18,937,151 $26,800,000
Sciences 2009-01 $4,439,991 $2,159,010 $2,280,981 $4,400,000


A prickly example

While it is indeed looking sharp, this graph is uninformative.

Read more

The Graphical Resume- New Concept and Possible Innovation

I love exploring the possible intersections of technology and information, with the intent to improve or expedite knowledge sharing. One of my recent epiphanies was related to the difficulty of efficiently reviewing resumes, especially technical resumes. Recruiters and managers spend huge amounts of time reviewing resumes (at least they used too) and automated tools have … Read more

Data warehousing success- 100% Vision / 80% Tactical / 20% of the Work

My Background in Data Warehousing

I have been involved in the creation, development, and maintenance of seven data warehouses through the years- one of them before I even knew about the term “data warehousing”!   I have built them with SAS and Oracle, SAS alone, Informatica and Oracle, Oracle alone, and SQL Server.

I have also visited many companies as an adviser, consultant and user of their data warehouse. In these many visits, I have seen some successes and many failures. Often, the failures could have been prevented with some key guiding principles.

Data Warehousing or Enterprise Data Integration?

Data warehousing is now known by a new buzz word, Enterprise Data Integration. In fact, SAS recently renamed SAS ETL Studio as SAS Data Integration Studio (they also added some new features around the EDI area, one new feature was around continual data acquisition so that near real time data feeds are available in the data warehouse.) Another great part of SAS EDI is SAS Data Quality, this should be a consideration throughout the entire process, but I won’t directly comment about data quality in this post. Since most people still use the term data warehousing, so I will keep the popular terminology over the analysts and even SAS.

What Does it Take to Build a Successful Data Warehouse?

Read more

Effectively Communicating Survey Data

Effectively Communicating Survey Data: Beyond Text Tables and Pie Charts A review of an article from Investor’s Business Daily and recommended improvements is covered in this presentation.   The topic of the article is “Obama Terrorism Grade”, a summary of a survey conducted in early April, 2009 by Technometrica Market Intelligence. The Results are summarized … Read more

SAS for Dummies

Whether you are a grad student, business analyst, statistician, or even a long time user of SAS software- SAS for Dummies (available at Amazon) offers quick access to a vast survey of practical knowledge using the new and exciting world of SAS 9. If you are using the latest version of SAS Learning Edition (version … Read more