Effectively Communicating Survey Data: Beyond Text Tables and Pie Charts
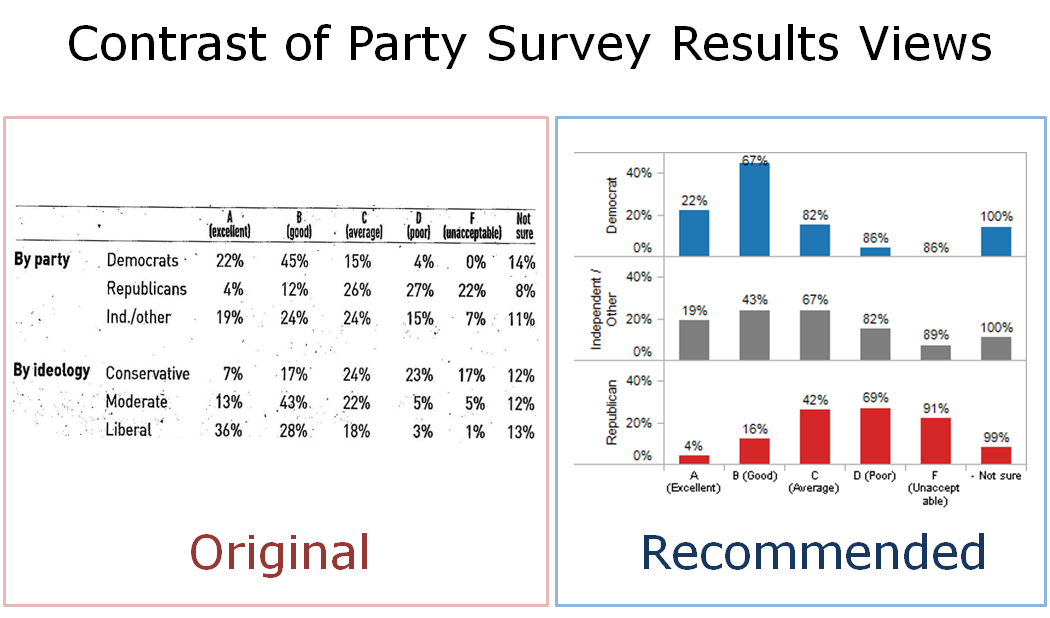
A review of an article from Investor’s Business Daily and recommended improvements is covered in this presentation. The topic of the article is “Obama Terrorism Grade”, a summary of a survey conducted in early April, 2009 by Technometrica Market Intelligence.
The Results are summarized three ways in the article:
– Overall for all respondents
– By political party
– By ideology
Two presentation methods are used:
– Pie chart
– Two text tables
Weaknesses of the chosen presentation method are covered and recommended improvements are shown.
Sample from presentation:

The presentation is available here in Adobe PDF format.
Securely share R shiny apps
Develop R shiny apps
All on one dedicated, secure and powerful platform.