Rapid Graphs with Tableau 8
The Original Guide for the Accidental Analyst
 We are pleased to provide free access to our book for all site members. It is also available as a printed book on Amazon. The home page for this release is here.
In Chapter 5 (pages 79-96)
Advanced view types in Tableau-79
Scatter Plots—explore relationships-82
Circle Plots—go beyond bar charts-83
Circle views-83
Side-by-side circles-86
Packed Bubbles-87
Maps—great for location data-88
Symbol maps-88
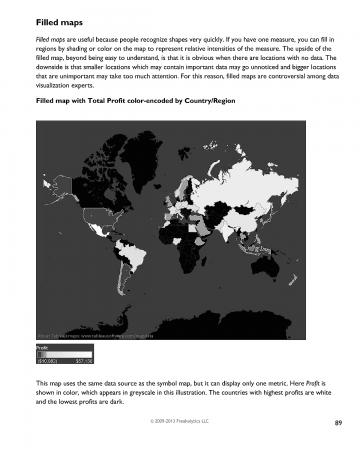
Filled maps-89
Area Charts—track multiple groups over time-90
Dual combination-95
Gantt Chart—track activity over time-96
Chapter 5 pages[s2If !is_user_logged_in() AND is_year(1970)]
Login to view the chapter
-OR-
Register for free to view the chapter
If you logged in but this page didn’t auto-refresh, use your browser refresh button or
[/s2If][s2If is_user_logged_in() OR !is_year(1970)]
[portfolio_slideshow ids=”10119,10120,10121,10122,10123,10124,10125,10126,10127,10128,10129,10130,10131,10132,10133,10134,10135,10136,9972,10114,10112″ width=full]
Use the controls to navigate. On touch-screens, you can swipe to navigate. Click on the slide to advance, click the four squares in the controls for the thumbnails to appear and click the four-way arrows for full-screen viewing. While in full-screen viewing mode, you can use the right/left arrow keys to advance/go back or simply swipe right and left on touch-screens. Use the ESC key or x in bottom control-bar to exit full-screen mode.
[/s2If]Chapter 4 is available here and Chapter 6 is over here.
Be sure to watch the videos that accompany this book:
Better Analytics with Tableau 8 Part 1
Better Analytics with Tableau 8 Part 2