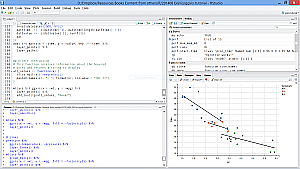
 At Freakalytics, we frequently use R (often referred to as RStats) in our client projects and wanted to share our success using the RStudio Interactive Development Environment (IDE) with you. So, we created the RStudio® Keyboard Quick Reference by Freakalytics. It is available to you, compliments of Freakalytics, as a PDF and later in this article as a searchable data table.
The RStudio IDE was built by the team at RStudio to make you more productive in the R world. It is a free, open source application for Windows, Linux, Mac and UNIX desktop users. RStudio Desktop includes an interactive R console, a smart editor that supports direct code execution, graphing interfaces, code history, a debugger and project management for R code and related files.
Download the RStudio® Keyboard Quick Reference by Freakalytics. The reference card is available as a PDF download for your convenience. The PDF version is printable and usable in most e-book applications.
In addition the PDF version, we are pleased to share online access to the RStudio® Keyboard Quick Reference as a searchable data table (click here to access the searchable data table in a dedicated window.) This searchable data table has all the shortcuts from the PDF -and- advanced shortcuts not shown on the PDF version (which is one-page for newer users of R).
Data Warehousing
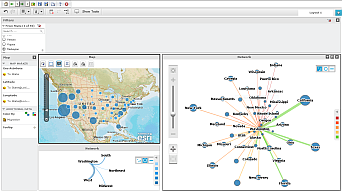
From Business Intelligence to Visual Analytics
Craft a Winning Data Strategy
Stephen McDaniel and Eileen McDaniel, Ph.D. Freakalytics, LLC Topics: Data Analysis, Visual Analytics and Business Intelligence This was originally published in the TDWI FlashPoint Newsletter in August of 2014 Italicized sections, images and their captions were not part of the TDWI version. Until recently, visual analytics was considered a niche area. Those days are quickly … Read more
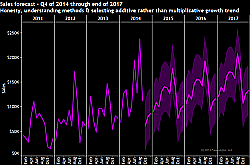
Honesty, the first principle of good analytics

Meet Dieter Rams – Industrial Designer
Dieter Rams is a German industrial designer most closely associated with the minimalist designs of the consumer brand Braun. Dieter was head of design at Braun for over 30 years, where he became famous for creating an austere aesthetic while focusing on user-friendliness. His philosophy is summed up in his saying, “Weniger, aber besser.” which translates into “Less, but better.” He has won many awards through the years including the World Design Medal and the Ikea Prize.
Dieter’s impact reaches beyond his retirement as he is now impacting design in the 21st century, with a company widely considered a leader in technology design, Apple, acknowledging a debt to Dieter as inspiration for many of their design decisions. The Head of Design at Apple wrote, “Rams’s work is beyond improvement… Rams’s ability to bring form to a product so that it clearly, concisely and immediately communicates its meaning is remarkable.”

Ten principles of good design
As a prolific designer, Dieter formulated ten principles of good design. In this series of articles, I will adapt several of these principles for guidance in creating good analytics. I have selected the sixth principle of good design as the one I consider most important for good analytics.
The sixth principle of good design
6. Is honest – It does not make a product appear more innovative, powerful or valuable than it really is. It does not attempt to manipulate the consumer with promises that cannot be kept.
 The first principle of good analytics
PowerTrip Analytics™ 2014
Candid Quadrants™
Based on three-year visual analytics cost estimates
Detailed cost comparisons across all seven visual analytics offerings at PowerTrip Analytics™ pricing review tables. Read individual product details, highlights and examples: Microstrategy Analytics Desktop, SAP Lumira, Tibco Spotfire, Microsoft Power BI, Tableau Desktop, QlikView, and SAS Visual Analytics.
Download data to predict gender using first name (US data)
Do you have data with just first names or even just first initials but no information on the person’s gender/sex? If you would like better insights on your customers, based on whether they are likely male or female, then this data download is a great way to maximize your ROI! Download it today and begin … Read more
Top 5 Stories Worth Reading in Data, Data Warehousing, Analytics & BI
February 23rd, 2014
Stephen McDaniel
Chief Data Officer Advisor at Freakalytics, LLC
Finding it hard to make time to keep up with the rapidly changing world of data, data warehousing, analytics, data science, business intelligence and visual analytics? We understand! Each week, I read through hundreds of stories in this space and share the five (okay, this week I couldn’t stop and chose six) most worthwhile articles with you. Each article includes a summary and link to the full story. Please note that inclusion of an article does not indicate that I agree with every point in the article, but I at least find it thought-provoking and useful for informed debate.
In the big data talent wars, most companies feel they’re losing. Marketing leaders are finding it difficult to acquire the right analytical talent. In the latest CMO Survey, only 3.4% senior marketers believe they have the right talent. Business-to-business companies have a bigger gap than business-to-consumer companies, as do companies with a lower percentage of their sales coming from the internet. And yet analytic skill is a must for effective marketing.
Results indicate that companies with above-average marketing analytics talent experienced significantly greater rates of marketing return on investment (MROI) than companies with below average analytics talent…
Big Data doesn’t lie. Or does it?
If you’ve seen any indication that humans are getting smarter and more sophisticated, please inform me, and you don’t have to read what follows. For everyone else, who sees no lack of stupidity and misinformation in both business and public life, read on about the joys big data will bring.
…
The insights offered by analysis of big data are only as good as the human beings that create the data, gather and assemble it, decide what questions should be asked and how the data is presented. And interpreted, especially that.
…
I am very concerned that big data, misapplied and misunderstood, will create big lies. Or more likely a combination of lies and truths that prove very difficult to sort out.
One way businesses can turn the information into something useful is through data mining. Data mining is a process used to analyze raw information to try and find useful patterns and trends in it.
…
“Data mining applications help users discover correlations and connections within large data sets,” Software Advice writes on its website. “These might have gone unnoticed without these algorithms.”
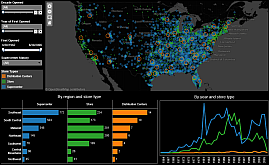
Scientific dashboard with periodic table of elements
Includes history, photos, great filters, discoverers and more
There is nothing we love more than sharing great examples of what is possible with visual analytics and dashboards. It’s one of the best ways to inspire new analysts and expand people’s horizons of the nearly infinite number of ways that visual analytics tools like Tibco Spotfire can be used.
Top News – Analysis & Commentary
Data, Data Warehousing, Analytics & BI
Five Business Intelligence Predictions
from Paxata for 2014
January 26th, 2014
Stephen McDaniel
Chief Data Officer Advisor at Freakalytics, LLC
![]() Finding it hard to make time to keep up with the rapidly changing world of data, data warehousing, analytics, data science, business intelligence and visual analytics? We understand! Here’s a top new story worth reading and that we considered noteworthy enough to add commentary and analysis by Freakalytics (in purple). A summary of the article and excerpts that I comment on are in black.
Finding it hard to make time to keep up with the rapidly changing world of data, data warehousing, analytics, data science, business intelligence and visual analytics? We understand! Here’s a top new story worth reading and that we considered noteworthy enough to add commentary and analysis by Freakalytics (in purple). A summary of the article and excerpts that I comment on are in black.
In this commentary and analysis, we cover the growth of Tableau and QlikView, the opportunities that exist for Microsoft to disrupt the second-generation business intelligence market and how self-service data integration will likely make data scientists & data enthusiasts much more productive- enabling wide swathes of Accidental Analysts to quickly answer tactical business questions.
Five Business Intelligence Predictions For 2014 (from the CEO of Paxata)
Summary
The dust is finally beginning to clear from the big data explosion, which is a good thing. One of the problems with big data is that it’s been led by technology, not business requirements. And business requirements will be the focus in the 2014 business intelligence (BI) ecosphere—to enable enterprises to achieve results with data mining and analytics and to prove those results.
Stephen
I found this article a fascinating glimpse into the strategic thoughts of a CEO of a promising, second-generation, cloud-based data integration company- Paxata.
Top 5 Stories Worth Reading in
Data, Data Warehousing, Analytics & BI
January 26th, 2014
Stephen McDaniel
Chief Data Officer Advisor at Freakalytics, LLC
Finding it hard to make time to keep up with the rapidly changing world of data, data warehousing, analytics, data science, business intelligence and visual analytics? We understand! Each week, I read through hundreds of stories in this space and share the five most worthwhile articles with you. Each article includes a summary and link to the full story.
 How Netflix Got Analytics Wrong, Then Right
Two entertaining and informative articles about Netflix illustrate how to be smart about using analytics. In one instance we see where Netflix went wrong, and in another we see Netflix doing the right thing.
Netflix launched a high-profile crowdsourcing project in 2006 to develop a better recommendation engine, offering a $1 million prize to any person or team who could improve Netflix recommendations by a modest 10 percent.
 Signs That Your BI Dashboard Needs a Comeback
Everyone loves a good comeback. Stories about celebrities like Robert Downey Jr. and Britney Spears climbing back to the top after falling so far capture our collective imagination. Movies like Rocky and Cinderella Man – about underdogs making a comeback – inspire us to think we ourselves can rebound from any setback.
Is your business intelligence dashboard the underdog at your organization? Dashboards have been around for decades, with some companies not putting the time and effort into updating them regularly to keep pace with the innovations in BI and the growing expectations of users.
 “Pitch Perfect” And How Analytics Are Transforming Movie Marketing
When Universal released the cult musical film Pitch Perfect in 2012, they did what any self-respecting studio would do: They commissioned marketing reports and forecasted ticket sales for the Anna Kendrick-starring movie. Among them was an analysis by a company called Fizziology which data-mines social media to see how the film would play out with audiences.
Upcoming analytics courses, free webinars and articles
December 2013 newsletter
Thanks for your interest in our newsletter, please forward it to colleagues that may benefit from it. Please join us for our upcoming webinar next Monday on common analytic issues and mistakes in Tableau 8.
 Eileen and I are excited to share our new courses on Tableau, Microstrategy Analytics Desktop (a free alternative for visual analytics and dashboards), SAS programming and data exploration and visualization are all available for on-site instruction.
We are booking engagements with clients for on-site training and strategic consulting projects throughout Q1 and into Q2 of 2014, please let us know if we can help you in 2014!
Data Management and Visual Analytics with Tableau (2 days)
January 28th-29th, 2014—Chicago, Illinois
Everyone can benefit from learning a reliable, flexible and repeatable method to analyze real-world data. Combine this with a solid grounding in the flow and core features of Tableau to achieve great returns with this course. In just two days, you will complete multiple real-world case studies with Tableau paired with supporting data management capabilities of Microsoft Excel and Microsoft Access.
Data Management and Visual Analytics with Microstrategy Analytics Desktop (2 days)
Microstrategy Analytics Desktop is an exciting new offering of Microstrategy, an established leader in business intelligence. Available as a free product for both personal and professional use, Freakalytics considers this new product a good alternative to other leading products in visual analytics and analytic dashboards. It is capable of working with local data sources such as Excel, text files and Access databases in addition to remote, big data sources such as SQL Server, Oracle, MySQL and Hadoop.
A spin-free explanation of data warehouse versus big data
“It should be no surprise that many Hadoop (big data) systems sit side by side with data warehouses. These systems serve different purposes and complement one another.”
– Joint quote from CTO of cloudera and General Manager at Teradata
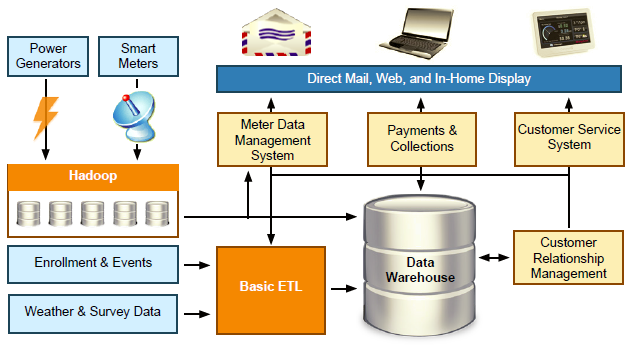
As you may have heard, big data is all the craze and at the top of the technology hype cycle! In my opinion, it is thoroughly confusing business execs, overwhelming IT teams and being used to market a massive range of new startups, sometimes justifiably. The reality is that big data will most likely NOT replace your data warehouse and the data scientist will most likely NOT replace your business analyst teams.
In a recent white paper,