A review of the growth of US Federal Government Debt as a % of GDP since 1970
Republican Presidents grew US debt at much higher rates than Democratic administrations
Average Republican debt growth of 27% versus 4% for Democratic Presidential administrations

There has been much written about the debt of the US government in the past few months. Of course, many authors and speakers have a particular political objective in their statements, articles and editorials. Prior to crafting this web site, I gathered and reviewed the key data values needed to examine this critical question. My purpose is to present the facts in a clear manner that will allow you to easily understand and compare the debt levels of the current and previous Presidential administrations since 1970.
Before creating this analysis, I had assumed that the two parties would be at similar levels of debt reduction or increases, with my original thought being that Republicans would have a slight edge in restricting the growth of US debt. After developing this analysis, I was genuinely surprised to find that it wasn’t even close- since 1970, Republicans have been less successful at managing US debt increases when in control of the Presidency, versus Democratic Presidential administrations.
For this analysis, I chose to examine the debt of the federal government based on the % of Gross Domestic Product (GDP.) GDP includes all goods and services produced within the US and is generally considered the best measure of a country’s productivity. Instead of examining nominal dollars spent or even “real dollars” (adjusted for inflation), I chose % of GDP as a superior metric since it allows you to easily understand and compare the debt level across long time spans. As a measure for this analysis, % of GDP minimizes the impact of both inflation and population growth.
Another advantage of the % of GDP approach is that fact that you can roughly approximate your family’s share of the US debt by multiplying your Gross Income by the debt as a % of GDP to understand your family’s share of this debt (actually, you would also need to multiply this by a factor slightly higher than 1, since the GDP of the US is actually higher than the individual incomes of all citizens!)
Debt reduction- Clinton the clear winner based on two measures of debt growth
When examining debt as a % of GDP, you can either compare:
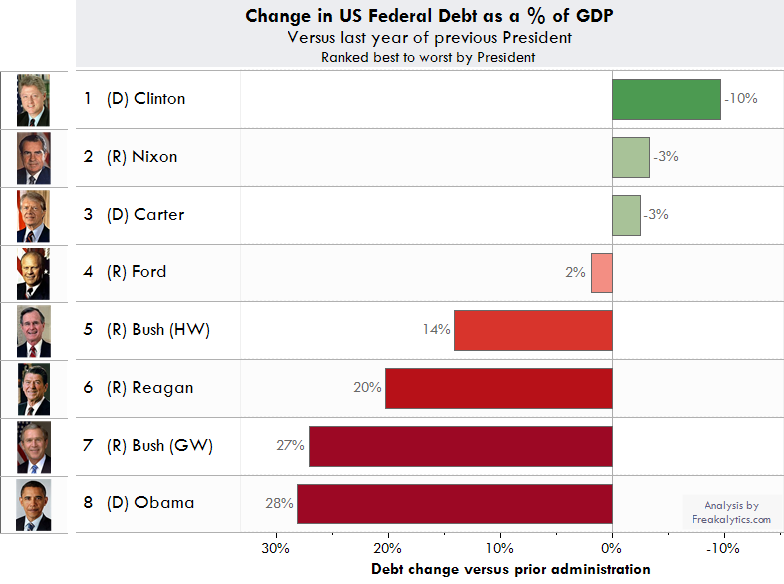
Change in US debt as a % of GDP, which is calculated as
US debt as % of GDP, last fiscal year of a President’s administration
minus
US debt as % of GDP, last fiscal year of the previous President’s administration
OR
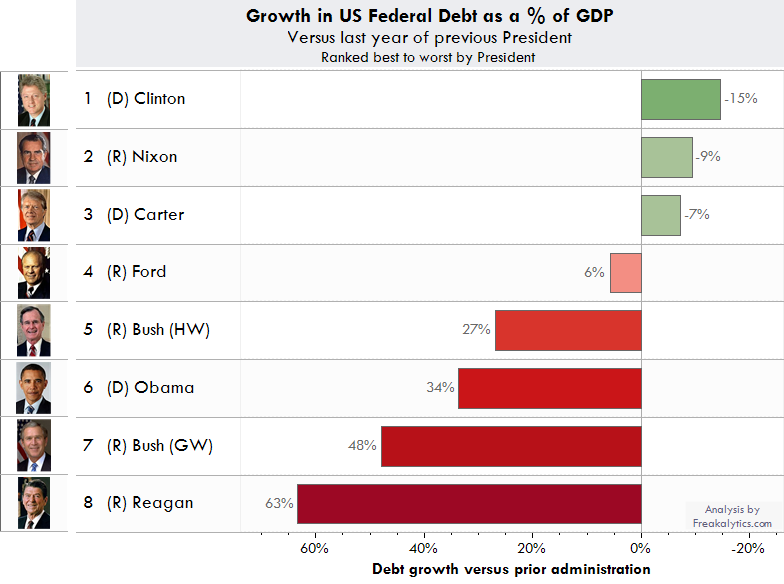
Growth in the debt as a % of GDP, which is calculated as
(US debt as % of GDP, last fiscal year of a President’s administration
minus
US debt as % of GDP, last fiscal year of the previous President’s administration)
divided by
US debt as % of GDP, last fiscal year of the previous President’s administration
There are pros and cons to each measurement method. An example should illustrate the difference between these two approaches. President Reagan inherited US debt levels at just 32% of the US GDP from President Carter. By the end of his two terms as President, the debt had risen to 52% of GDP. The first method, Change in US debt as a % of GDP, would yield debt growth of 20% of GDP, calculated as 52% — 32% = 20%. The second method, Growth in the debt as a % of GDP, yields a 63% rise in overall debt as a % of GDP, (52% — 32%) / 32% = 63%. Examining debt growth with either method, President Reagan was either very high in debt growth or the highest of all the Presidential administrations under review in this data, depending on which metric you select to rank their debt growth performance.
Using the first method, Change in US debt as a % of GDP, Clinton is the best while Obama is the worst (interestingly, both Democrats!) However, the average change with this measure is just +5.3% for all Democratic administrations but +12.0% with Republican administrations, a margin of over 2 to 1 against Republican administrations at managing the US debt.


Using the second method, Growth in the debt as a % of GDP, Clinton is still the best while President Reagan is the worst with President GW Bush (2001-2009) not far behind (chart at the top of this article). The average growth with this measure is just 3.9% for Democratic administrations but 26.9% for Republicans, a margin of more than 6 to 1 against Republican administrations!

For your reference, here are the details for the last fiscal year and budget passed by each President. The data is based on information from the US Congressional Budget Office.

US Federal Debt by year

The final chart shows the US Debt as % of GDP by year since 1970, the chart is also subdivided by the approving President during the budget process.
There are several interesting points I would like to share with you when viewing this chart.
- During the 1970′s, under President’s Nixon, Ford and Carter, the debt as a % of GDP remained relatively stable ranging between just 32% and 36%. This was a period of stagflation (high unemployment and high inflation), but was actually a good period relative to managing the US debt burden as a % of GDP.
- During the 1980′s through the end of the Reagan/Bush era, US debt as % of GDP soared- more than doubling from 32% at the end of President Carter’s administration to a high of 66% at the end of President HW Bush’s administration.
- The only marked decline in the debt as a % of GDP was under President Clinton, falling by 15%. This was also a period of growth after the recession marking the end of President HW Bush’s administration.
- In the 2000′s, under President GW Bush, the debt once again soared from 56% to 84% of GDP, growth of 48%.
- Continuing the trend from President GW Bush, the debt has risen under President Obama from 84% to 112% for FY 2012, growth of 34%.
We hope you find this useful in examining this important issue based on the facts. We exercised due diligence to be fair and accurate. However, if you spot a factual error in this analysis, please contact us at @Freakalytics on Twitter.
Please share this with your friends and followers on Twitter and Facebook using the buttons below. This site is hosted by Freakalytics.com, you can visit us using the links found on the page header at the top of this article.