Rapid Graphs with Tableau 8
The Original Guide for the Accidental Analyst
 We are pleased to provide free access to our book for all site members. It is also available as a printed book on Amazon. The home page for this release is here.
In Chapter 4 (pages 59-78)
Core view types in Tableau-59
Tables—an eye for detail-62
Text tables-62
Highlight tables-64
Heat maps-65
Bar Charts—five flavors
to meet your needs-66
Horizontal bars-67
Stacked bars-69
Side-by-side bars-70
Histogram-71
Bullet graphs-72
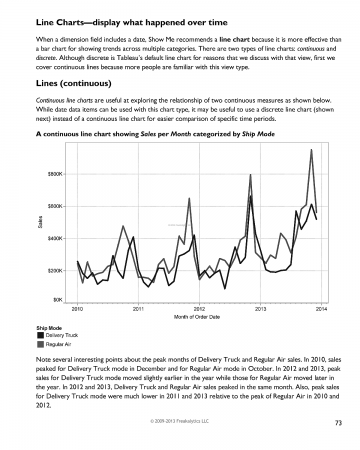
Line Charts—display what happened over time-73
Lines (continuous)-73
Lines (discrete)-74
Percent-of-Total—contribution of categories to the overall amount-75
Pie charts-75
Treemaps-77
Chapter 4 pages[s2If !is_user_logged_in() AND is_year(1970)]
Login to view the chapter
-OR-
Register for free to view the chapter
If you logged in but this page didn’t auto-refresh, use your browser refresh button or

[/s2If][s2If is_user_logged_in() OR !is_year(1970)]
[portfolio_slideshow ids=”10058,10059,10060,10061,10062,10063,10064,10065,10066,10067,10068,10069,10070,10071,10072,10073,10074,10075,10076,10077,9972,10114,10112″ width=full]
Use the controls to navigate. On touch-screens, you can swipe to navigate. Click on the slide to advance, click the four squares in the controls for the thumbnails to appear and click the four-way arrows for full-screen viewing. While in full-screen viewing mode, you can use the right/left arrow keys to advance/go back or simply swipe right and left on touch-screens. Use the ESC key or x in bottom control-bar to exit full-screen mode.
[/s2If]Chapter 3 is available here and Chapter 5 is over here.
Be sure to watch the videos that accompany this book:
Better Analytics with Tableau 8 Part 1
Better Analytics with Tableau 8 Part 2
