Rapid Graphs with Tableau 8 –
now on Amazon and on Freakalytics.com

Rapid Graphs with Tableau 8
The Original Guide for the Accidental Analyst

The 8 version of this book is published in grayscale in order to meet popular demand for a lower list price versus earlier versions (5, 6 and 7) of this book series.

Rapid_Graphs_Tableau_8_Freakalytics_Copyright_346_433
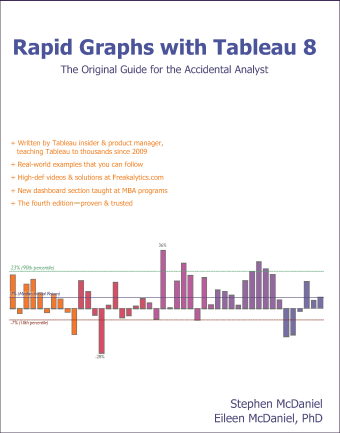
+ Written by Tableau insider
& former product manager, teaching
Tableau to thousands since 2009

+ Real-world examples that you
can follow include tips
and tricks to save you time

+ High-def videos & solutions

+ The fourth edition—proven & trusted

+ Buy it on Amazon

Preview the table of contents and Chapter 1 here.

Exclusive to Freakalytics, we are granting free online access to Rapid Graphs with Tableau 8!

201307_Quick_Dirty_Tableau_8_Freakalytics_027Read Chapter 2 (pages 21-39)

Build the core—Tableau basics—21
Download, install and open Tableau—22
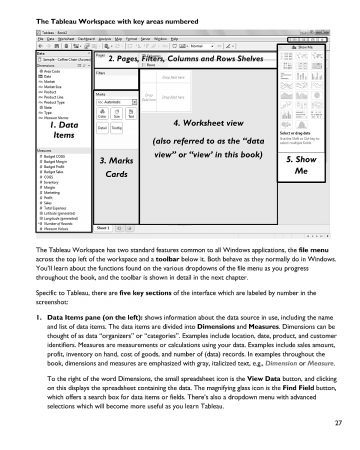
Connect to sample data and review the Tableau interface—25
“Show Me” Tableau in action—29
Categorically clear views—35

201307_Quick_Dirty_Tableau_8_Freakalytics_051Read Chapter 3 (pages 41-58)

Go with the flow—more Tableau basics-41
Save time with the Tableau toolbar-42
When tables trump graphs-44
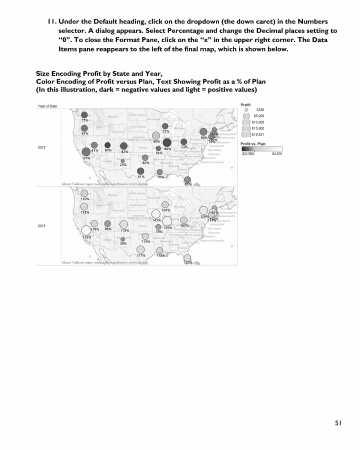
Insightful maps-48

Read more

Show growth over time but hide the baseline in Tableau

A client asked,

What I want to show is a YoY (year over year) or WoW (week over week) comparison – however the first data point is always missing – even when the underlying data are available.

For example:
The full set of data shows a null value for 2006 – just because there is no data available to compute a comparison.
Now I want to move the date filter to start @ 2007 – and now 2007 has a null value even though we have data available to compute that metric.
” What’s the issue and how can I display only years

Read more

Data Driven Conference 2012

We are having a great time at the Data Driven Conference in Columbus! Our first session was standing room only and we are presenting the same talk a second time at 1:30 in E161.

Interesting questions include “how do you become better at asking the right questions that lead to better analysis” and “how do you communicate with IT to get better data”?

To buy a copy of The Accidental Analyst, please visit www.AccidentalAnalyst.com.

Here is our infographic that we created

Read more

Patriotic colors and maps in Tableau (US colors)

 
While preparing for a conference, we decided to create a map to show the US states using patriotic (US flag) colors.   The colors of the US flag are precise, so we needed to modify the Tableau preferences file to use the correct colors (also, white is not part of the Tableau color palette for discrete data items.)

After modifying our Preferences.TPS file with a new US Flag color palette and saving it to My Tableau Repository (a directory, typically in My Documents), we were able to create the red, white and blue map of the US!   To download the Maps, a sample workbook and the changed Preferences.TPS file, just log in below.

Read more

Book Excerpt: Tableau 7 Quick Table Calculations and Custom Table Calculations

This is a free preview from Rapid Graphs with Tableau Software 7, available in print and Kindle on Amazon and on the Nook at Barnes and Noble. Due to width constraints on this blog, you may notice some loss in resolution compared with the purchased book, which has approximately 2.5 times better resolution.


Read more

2012 NCAA football rankings–ranks per poll & overall ranking

Teams inlcuded in this week:
USC, LSU, Alabama, Oklahoma, Oregon, Georgia, Florida State, Michigan, South Carolina, Arkansas, West Virginia, Michigan State, Wisconsin, Clemson, Texas, Ohio State, Stanford, Nebraska, TCU, Virginia Tech, Oklahoma State, Kansas State, Florida, Boise State, Notre Dame, Louisville, Washington, Auburn, Georgia Tech, North Carolina, Utah, NC State, Baylor, South Florida, Texas A&M, Cincinnati, Brigham Young, Tennessee, Mississippi State, Virginia, Louisiana Tech, UCF, Houston, Rutgers, Southern Miss, Missouri, Florida Intl, Northern Illinois, Texas Tech

Conferences included in this week:
SEC, Big 12, ACC, Big Ten, Pac-12, Big East, USA, Ind, Mid-Amer, Mntn Wst, Sun, WAC


Read more

2012 NCAA football rankings–top 25 teams per conference

Teams inlcuded in this week:
USC, LSU, Alabama, Oklahoma, Oregon, Georgia, Florida State, Michigan, South Carolina, Arkansas, West Virginia, Michigan State, Wisconsin, Clemson, Texas, Ohio State, Stanford, Nebraska, TCU, Virginia Tech, Oklahoma State, Kansas State, Florida, Boise State, Notre Dame, Louisville, Washington, Auburn, Georgia Tech, North Carolina, Utah, NC State, Baylor, South Florida, Texas A&M, Cincinnati, Brigham Young, Tennessee, Mississippi State, Virginia, Louisiana Tech, UCF, Houston, Rutgers, Southern Miss, Missouri, Florida Intl, Northern Illinois, Texas Tech

Conferences included in this week:
SEC, Big 12, ACC, Big Ten, Pac-12, Big East, USA, Ind, Mid-Amer, Mntn Wst, Sun, WAC


Read more

Webcast: “Big Data” on your laptop, fast, informative and at your command

NOTE: This fun review of “big data” was inspired by a recent presentation I gave on behalf of Tableau Software at the Big Data Conference in Chicago. You can find the 1st part of this 3 part webcast here, “Performance to Cost Index & my personal history with “Big Data” and Part 2 here, “Big Data” in US History, Exploring the 1790 US Census. This part of the big data series is free, just subscribe or sign in below.

In this presentation, I share an example of working with big data stored on my laptop and the entire analysis happens without any type of connection to remote servers or databases. My analysis uses two tables of interest, the first has 216 million records, over ten years of airline ticket pricing in the US while the second table has 72 million records of US airlines performance data extracted from Hadoop. In the demonstration, which uses currently available technologies, we will quickly explore and analyze this data for interesting trends and patterns.

Read more