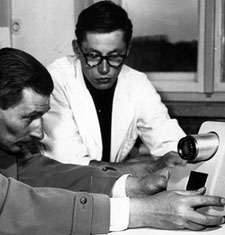
Meet Dieter Rams – Industrial Designer
Dieter Rams is a German industrial designer most closely associated with the minimalist designs of the consumer brand Braun. Dieter was head of design at Braun for over 30 years, where he became famous for creating an austere aesthetic while focusing on user-friendliness. His philosophy is summed up in his saying, “Weniger, aber besser.” which translates into “Less, but better.” He has won many awards through the years including the World Design Medal and the Ikea Prize.
Dieter’s impact reaches beyond his retirement as he is now impacting design in the 21st century, with a company widely considered a leader in technology design, Apple, acknowledging a debt to Dieter as inspiration for many of their design decisions. The Head of Design at Apple wrote, “Rams’s work is beyond improvement… Rams’s ability to bring form to a product so that it clearly, concisely and immediately communicates its meaning is remarkable.”

Ten principles of good design
As a prolific designer, Dieter formulated ten principles of good design. In this series of articles, I will adapt several of these principles for guidance in creating good analytics. I have selected the sixth principle of good design as the one I consider most important for good analytics.
The sixth principle of good design
6. Is honest – It does not make a product appear more innovative, powerful or valuable than it really is. It does not attempt to manipulate the consumer with promises that cannot be kept.
 The first principle of good analytics
1. Is honest – a good analysis seeks to share the reality of the situation. A key component of honesty is sharing the level of uncertainty about the data, the questions, the reliability of past analyses, the limitations of the methods employed and the level of uncertainty surrounding any prediction of future events.
This principle does not require that you lead your presentation with the details listed above, which could leave people feeling helpless, but you should thoughtfully incorporate the limitations as relevant in the appropriate places in your presentations or dashboards. It is incumbent upon the lead analyst to understand the audience, their expectations and their knowledge about these topics. Considering these areas, your presentation should either gently or forcefully remind them of the relevant limitations as needed.
An exception is made for critical topics that should be addressed in the beginning of your presentation. Examples of critical topics includes significant changes in methodology since the last review, changes in assumptions about future business conditions or any other material change in the data or inputs to future forecasts.
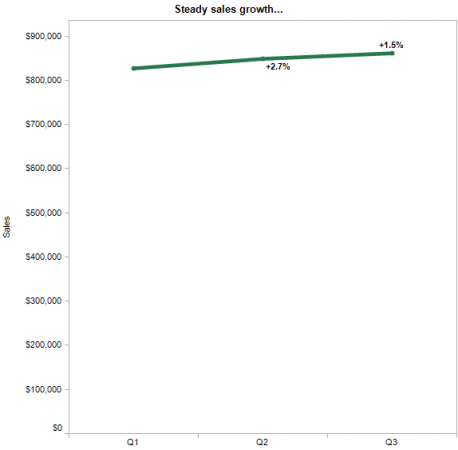
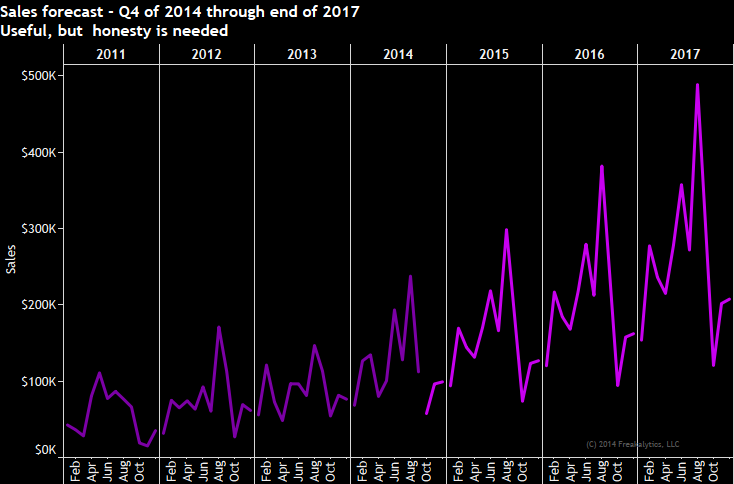
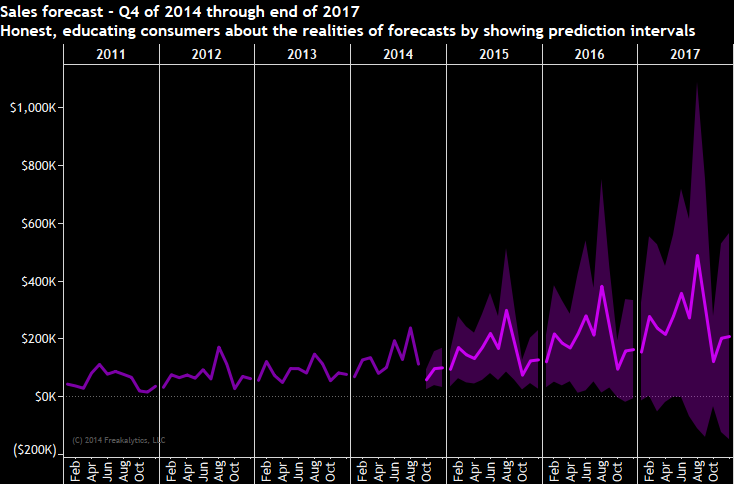
An example of clear deception & correction with the principle
Seeking to tell the people what they want to hear

Making reality clear
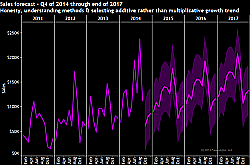
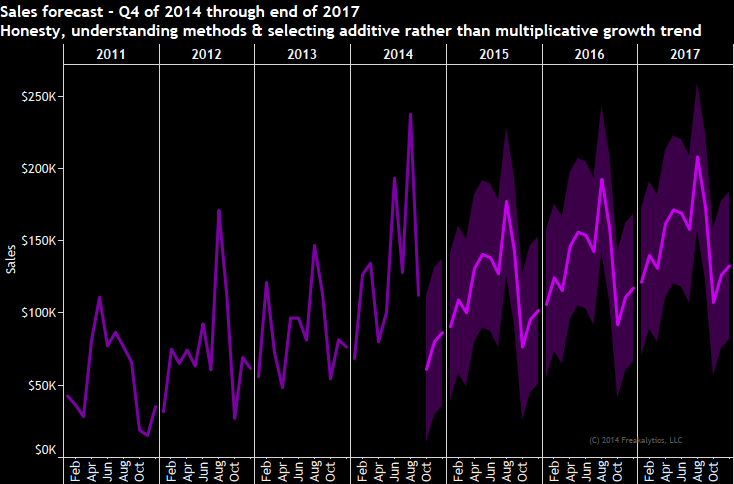
A second illustration, conveying the right level of certainty & correcting models
By displaying a single line for the future values, too much certainty is conveyed
Much better, you can clearly see that uncertainty increases the further out you plan
Even better, by understanding the dynamics of the business
and adjusting the forecast model, a more conservative forecast is created
Securely share R shiny apps
Develop R shiny apps
All on one dedicated, secure and powerful platform.