Free Webinar—Business analytics and more
with SAS Enterprise Guide

 
Recorded on July 10th, 2013
 
 
Business_analytics_SAS_Enterprise_Guide_predictive_model_600
 
 
True genius resides in the capacity for evaluation of
uncertain, hazardous, and conflicting information.

–WINSTON CHURCHILL
Prime Minister of England during WWII


Synopsis
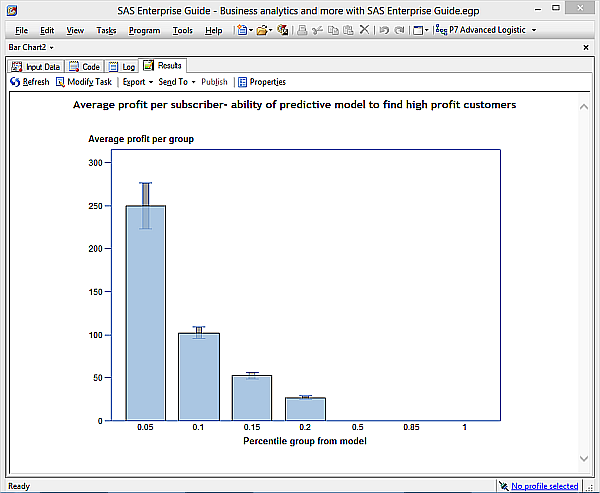
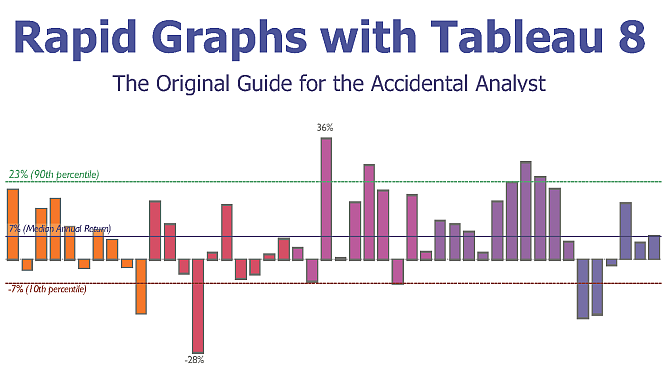
In this webinar, Stephen will analyze multiple real-world case studies using SAS Enterprise Guide by following the 7 C’s of Data Analysis. He will collect data from a range of sources, explore the data for common problems, apply quick data fixes, demonstrate best practices of visual analytics and use powerful predictive models that go beyond the limits of standard analysis techniques.
Click here for the full post and to register below

Read more

Rapid Graphs with Tableau 8—Chapter 1 & Table of Contents

The 8 version of this book is published in grayscale in order to meet popular demand for a lower list price versus earlier versions (5, 6 and 7) of this book series.

Rapid_Graphs_Tableau_8_Freakalytics_Copyright_346_433+ Written by Tableau insider
   & product manager, teaching
   Tableau to thousands since 2009

+ Real-world examples that you
   can follow include tips
   and tricks to save you time

+ High-def videos & solutions

+ The fourth edition—proven & trusted

+ Buy it on Amazon


Read more

Freakalytics Newsletter for June 2013

Thank you for your interest in our newsletter. Please share it with your colleagues that can benefit from it.   Also, Stephen is once again full-time at Freakalytics and we are excited to be back on the road, so please let us know if we can be of service!


Freakalytics_Timeline_Since_2007_Map.pngFreakalytics Timeline

Since 2007, we have traveled 365,000 miles to help tens of thousands of people via

8 books,
24 conference talks,
47 public trainings,
26 on-site trainings,
5 conference seminars,
15 analytic advisory engagements
and 36 consulting projects.

Click here to download a summary of our accomplishments since 2007.


Read more

Free Webinar—Visual Analytics Best Practices
Why Can’t You See My Point?!?

201306-Freakalytics-Nuclear-Power-602

You can have brilliant ideas,
but if you can’t get them across,
your ideas won’t get you anywhere.

-Lee Iacocca


The webinar is past but you can watch the recording and view the slides below.
This post is currently being updated with the slides and videos.

Why do visual analytics best practices matter?

Why can’t people see your point when you present data-oriented presentations?

Whether you are using big data, small data or summarized data that has been prepared for you, this webinar will explore these vital questions. If you are concerned with getting the most from your data, this complimentary webinar is a great step in learning how to clearly communicate with people as they make better informed decisions in the hectic world of modern business.

Read more

Grayscale versus Color—Visual Analytics Best Practices
and Rapid Graphs with Tableau 8

black_white_bullet_300 
 
Get it right in black and white.

 
–Maureen Stone
  Leading expert on effective
  use of color in information visualization


A recent review on Amazon commented about our change in the Tableau 8 book to using grayscale images versus the prior versions using color images.   This post summarizes our thoughts on grayscale versus color usage in charts and graphs as well as the rationale for changing the book.

Thanks for taking the time to review our book.  Also, thanks for highlighting the high quality and thoroughness of the content — we are passionate about helping people analyze their data, which motivated Stephen to approach Tableau in 2008 about writing the first book on the software.

While the past few versions were indeed in color, many people asked if we could lower the list price for the launch of the 8.0 edition. We also are surprised at the high price of printing in color, especially a time-sensitive book like this one about Tableau (the software updates every 14-18 months and most publishers take 4-6 months -AFTER- the author finishes to get the books to market).  Unlike most publishers (large or small), our books sold in the U.S. are printed in the U.S., so we can publish relatively quickly after release.

Read more

Free Webinar—Better Dashboards in Tableau 8
Video and Slides Now Available

201306-Freakalytics-Nuclear-Power-602Attend this complimentary webinar for ideas and inspiration to design informative, dynamic and captivating dashboard experiences with Tableau 8.

The webinar is past but you can watch the recording, download the workbook and view the slides below.

In this complimentary webinar, Stephen will walk you through the steps to build one of the advanced dashboards that ships in Tableau 8. Stephen will be using the World Nuclear Power Plants example that he designed while Director of Analytics at Tableau. Stephen was inspired to create this example based on the work of Peter Aldhous at The New Scientist.

Click here for the rest of this post including webinar slides, video and example workbooks

Read more