Recorded on July 10th, 2013
True genius resides in the capacity for evaluation of
uncertain, hazardous, and conflicting information.
–WINSTON CHURCHILL
Prime Minister of England during WWII
Synopsis
In this webinar, Stephen will analyze multiple real-world case studies using SAS Enterprise Guide by following the 7 C’s of Data Analysis. He will collect data from a range of sources, explore the data for common problems, apply quick data fixes, demonstrate best practices of visual analytics and use powerful predictive models that go beyond the limits of standard analysis techniques.
Click here for the full post and to register below
Standard business analytics can be quite powerful, enabling you to see who did what and also where and when it happened. Advanced methods such as predictive analytics and data mining techniques can lead to a more valuable analysis for multiple reasons, by allowing you to:
1. Discover possible causes and even predictions for the future.
2. Avoid costly mistakes based on natural variability in the business data, a common error among business analysts.
3. Better separate noise in the data from a true signal, guiding you to confident decisions.
If time permits, a brief question and answer session will follow.
The webinar video
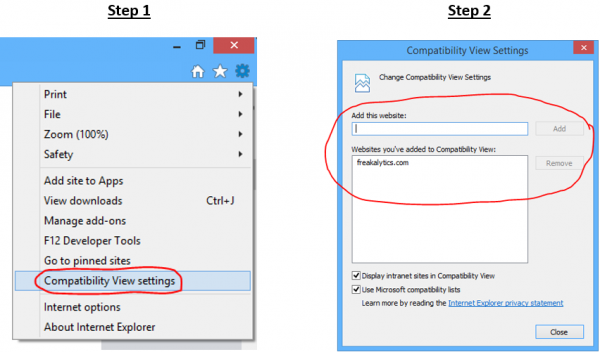
Internet Explorer requires compatibility mode to view the videos at Freakalytics. On newer versions of Internet Explorer, click the IE gear icon in the upper-right for menus, select Compatability View settings. A dialog appears where you should add freakalytics.com to your Websites you’ve added to Compatability View list.
On older versions of IE,
click the broken page icon at the far right of the address bar
![]()
[/s2If]
Video Index
03:50 Session roadmap and quotes
05:35 Why SAS Enterprise Guide matters
13:30 Big picture, practical usage in my work
14:45 Case study background
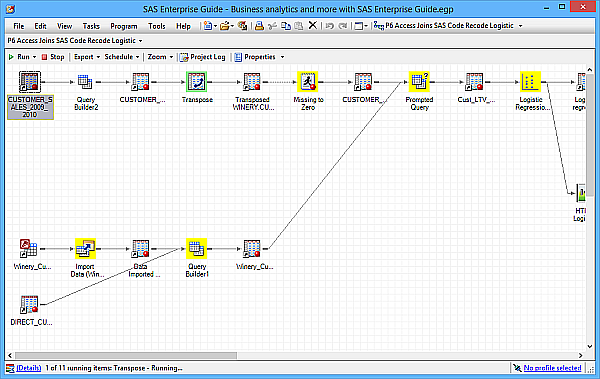
18:40 Analytic data preparation
23:30 Analytic data preparation demo
34:10 Data exploration and summaries
34:50 Data exploration and summaries live demo
40:10 Data mining and advanced analytics
42:40 Live demo
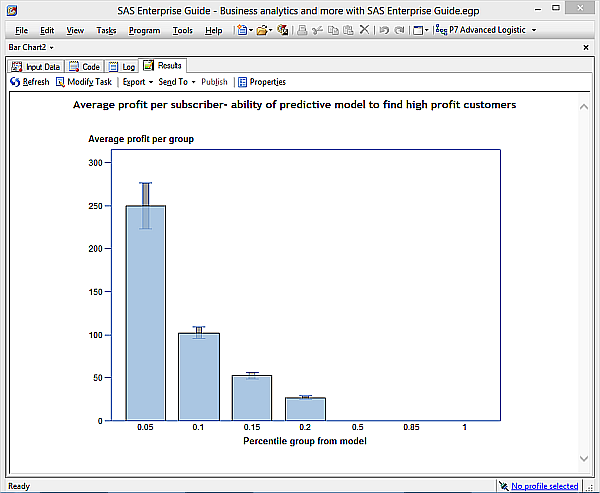
49:30 Forecasting and future customer ROI evaluation demo
54:10 Recap
The presentation from this webinar
Use the controls to navigate. On touch-screens, you can swipe to navigate. Click on the slide to advance, click the four squares in the controls for the thumbnails to appear and click the four-way arrows for full-screen viewing. While in full-screen viewing mode, you can use the right/left arrow keys to advance/go back or simply swipe right and left on touch-screens. Use the ESC key or x in bottom control-bar to exit full-screen mode.
[portfolio_slideshow include=”9693,9694,9695,9696,9697,9698,9699,9700,9701,9702,9703,9704,9705,9706,9707,9708,9709,9710,9711,9712,9713,9714,9715,9716,9717,9718,9719,9720,9721,9722,9723,9724,9725,9726,9727,9728,9729,9730,9731,9732,9733,9734,9735,9736,9737,9738,9739,9740,9741,9742,9743,9744,9745,9746,9747,9748,9749,9750,9751,9752″]
Enjoyed this? Please subscribe to our newsletter and share it!
We are a two-person, independent analytics company. Creating great content takes an enormous amount of time! You can support us by subscribing below and sharing this webinar with friends and colleagues. Thanks!
The webinar is past. Watch the recording and view the slides above.
Your attendance is complimentary thanks to sponsorship by The Accidental Analyst. Attendees with a US shipping address can optionally order a discounted copy of The Accidental Analyst with your ticket (shipping inclusive). Please allow two weeks after the webinar for the book to arrive.
About SAS Enterprise Guide
Only a handful of tools offer business analysts a single environment for data access, data management, data cleanup, simple analytics, predictive analytics, advanced graphics and a wide range of delivery options. SAS Enterprise Guide is just such a product, with an impressive depth and breadth of functionality-all based on the proven foundation of the SAS language.
Using an elegant point-and-click system with a clean workflow interface, you can access a wide range of data sources, review your data for possible quality problems, clean up dirty data, perform business analytics, access powerful predictive and data mining algorithms and deliver your results for a wide range of purposes. Most importantly, you can easily run your work in the future interactively or as a scheduled task. Working hard behind your analysis is the SAS language, which can be exported at any time for reuse and auditing.
Securely share R shiny apps
Develop R shiny apps
All on one dedicated, secure and powerful platform.