Thank you for your interest in our newsletter. Please share it with your colleagues that can benefit from it. Also, Stephen is once again full-time at Freakalytics and we are excited to be back on the road, so please let us know if we can be of service!
 Freakalytics Timeline
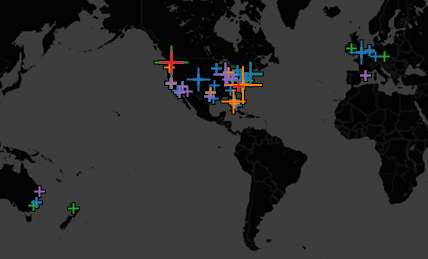
Since 2007, we have traveled 365,000 miles to help tens of thousands of people via
8 books,
24 conference talks,
47 public trainings,
26 on-site trainings,
5 conference seminars,
15 analytic advisory engagements
and 36 consulting projects.
Click here to download a summary of our accomplishments since 2007.
 Free Webinar
Better Dashboards in Tableau 8
June 14th, 9 AM Pacific,
Noon Eastern, 5 PM London
Attend this complimentary webinar for ideas and inspiration to design informative, dynamic and captivating dashboard experiences with Tableau 8.
 Free Webinar
Visual Analytics Best Practices
Why Can’t You See My Point?!?
June 26th, 8 AM Pacific,
11 AM Eastern, 4 PM London
Why do visual analytics best practices matter? Why can’t people see your point when you present data-oriented presentations?
 Rapid Graphs with Tableau 8
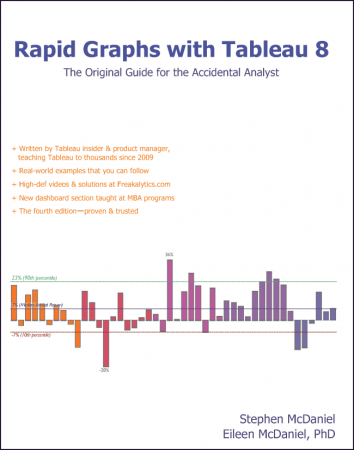
now on Amazon
+ Written by recent Tableau insider & product manager, teaching Tableau to thousands since 2009
+ Real-world examples that you can follow include tips and tricks to save you time
+ High-def videos
+ The fourth edition—proven & trusted
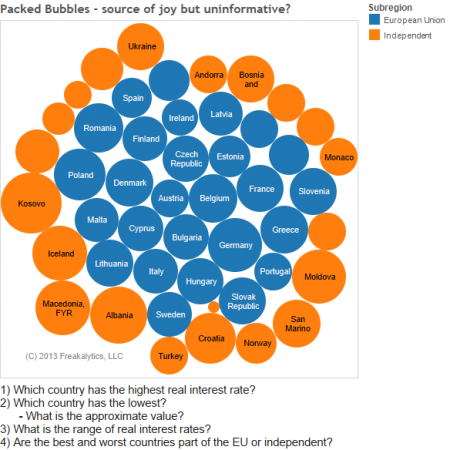 Joyful or informative charts?
Best practices in visual analytics
Stephen Few, noted visual analytics expert and a source of inspiration for Stephen, recently wrote about criticisms of best data visualizations practices. In particular, Amanda Cox of the New York Times said, “There’s a strand of the data viz world that argues that everything could be a bar chart. That’s possibly true but also possibly a world without joy.”
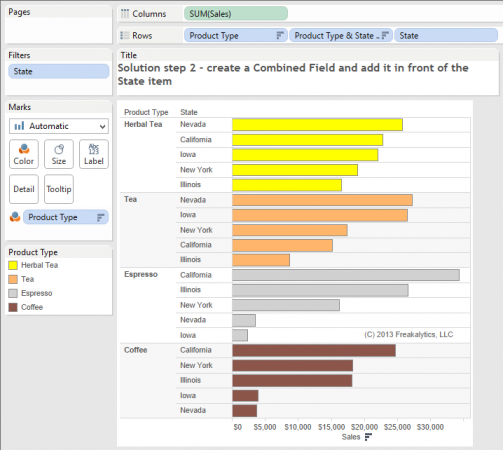 Tableau Tips: Nested sorting
not as expected-a simple fix
Many students have been confused about the Tableau data sort behavior. A common question is how to sort the data at a lower level correctly within each higher level of data in a view. One student recently came to us with this view and asked, “What’s up? I thought it would sort each state independently within each Product Type! In the first group, Herbal Tea, Nevada is clearly number one yet it is shown in the fourth position.”
Our last bit of news, Stephen recently left Tableau. He is happy to say that he is now our Principal Data Scientist at Freakalytics, where we offer the only independent source of strategic analytic advice and Tableau training. We can give you clear, open advice on how to maximize and integrate Tableau in today’s complex analytic environments.
Freakalytics
This newsletter is brought to you by the leading independent Tableau training source, Freakalytics. We offer training focused on solving real-world problems with your data, Tableau and other relevant analytic tools and technologies. Please contact us if we can be of service with on-site training at Info@Freakalytics.com
Best regards,
Eileen McDaniel, PhD and Stephen McDaniel
Freakalytics, LLC
Securely share R shiny apps
Develop R shiny apps
All on one dedicated, secure and powerful platform.