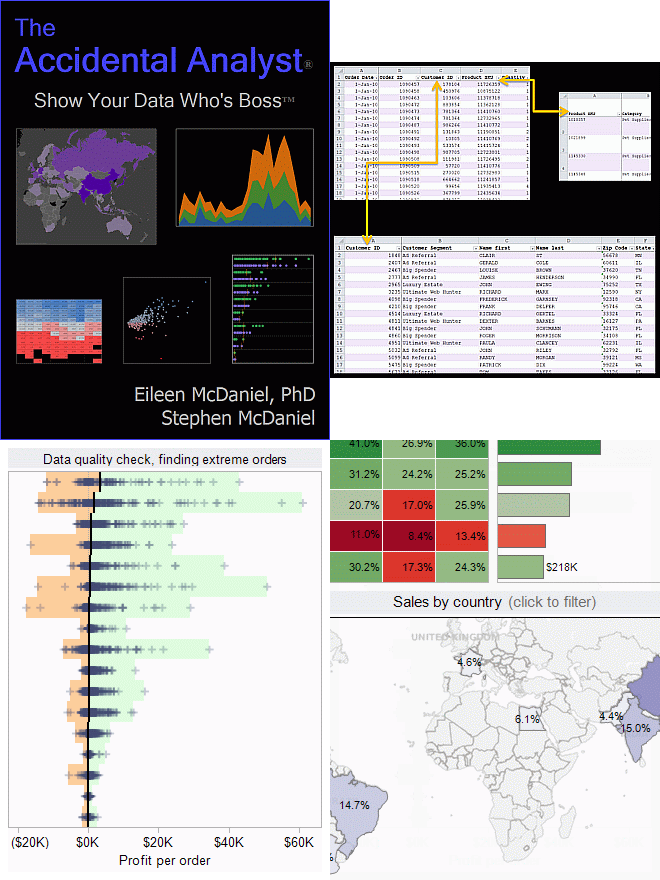
What can visual analytics & big data do for you?
In this 45 minute webinar, Stephen McDaniel will review visual analytic examples and demonstrate what big data analytics can do for you. Stephen will demonstrate this using Tableau 8.
Visual analytics- how is it different than traditional analytics?
Review several examples and how they empower decision-makers quickly and clearly
Build new analytic content from scratch in a matter of minutes
If time permits, a brief question and answer session will follow.
Registration is now closed.
Share the power of R shiny apps across the entire team with YakData
The team at Freakalytics has built YakData brightRserver, our new cloud platform.
Securely share R shiny apps
Develop R shiny apps
All on one dedicated, secure and powerful platform.
Securely share R shiny apps
Develop R shiny apps
All on one dedicated, secure and powerful platform.
Subscribe and keep in touch with us!