 From the article conclusions:
“Data blending is a new feature in Tableau that simpliï¬es the process of integrating data from a variety of heterogeneous sources. We presented several compelling customer applications that leverage the feature and highlight its usefulness for interactive visual analysis. Additionally, we are engaging with our customers to improve the flexibility and capabilities of the feature. Ultimately, our goal is to make it easier for users to discover and combine data that will help them in their exploratory analysis.”
If you are a data enthusiast who actually enjoys data management and warehousing, you will find this article fascinating and informative.
However, if you are still learning Tableau and want to understand this and related features, here is an excerpt from the section on Data Blending in our book, Rapid Graphs with Tableau Software:
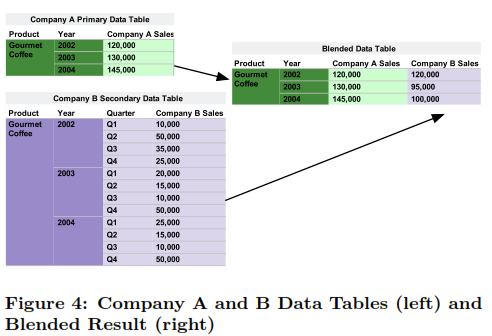
“A common reality for many users of Tableau is that their data is stored in multiple systems, such as Excel, Access, CSV files, Oracle databases and many other database systems. Early versions of Tableau <!–more–>allowed you to connect to multiple data sources at one time in the same workbook, but NOT in the same view. In other words, if you had budget data in your Excel data source and actual spending data in Oracle, you had no automated way to make a view comparing budget with actuals. Recent versions of Tableau allow you to blend your data to help you solve similar problems.
The following example uses the Country Blending …”
To download the article, “Dynamic Workload Driven Data Integration in Tableau” by Kristi Morton, Ross Bunker, Jock Mackinlay, Robert Morton and Chris Stolte, click here.
To learn how to use Data Blending in Tableau and create great analysis quickly, preview Rapid Graphs here.
Securely share R shiny apps
Develop R shiny apps
All on one dedicated, secure and powerful platform.
